University of Twente’s carbon footprint report for 2023 has been published. In the carbon footprint report, you can find all information on emissions caused by UT, including those caused by external suppliers, business trips and commuting. On paper, carbon emissions have increased in 2023 compared to 2022, because UT decided not to compensate for emissions caused by gas use in UT buildings through certificates like in 2022 and because of an increase in business travel. However, the total energy consumption of UT dropped by more than 9% compared to 2022, while gas use dropped by 23%.
The carbon footprint report is published by UT’s SEE programme in collaboration with Realised.
Total carbon footprint
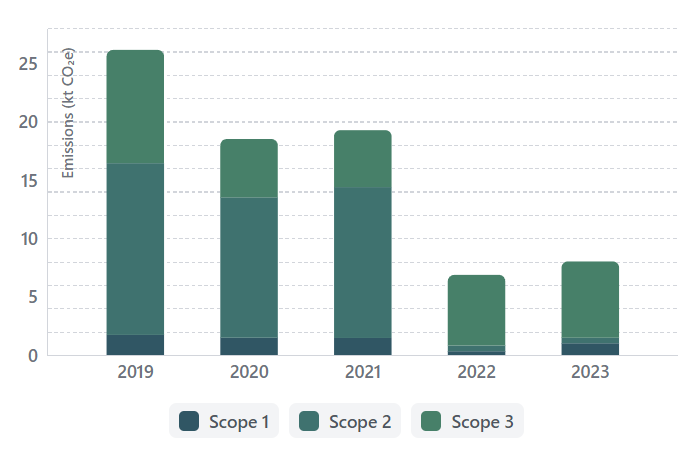
UT carbon footprint 2019-2023
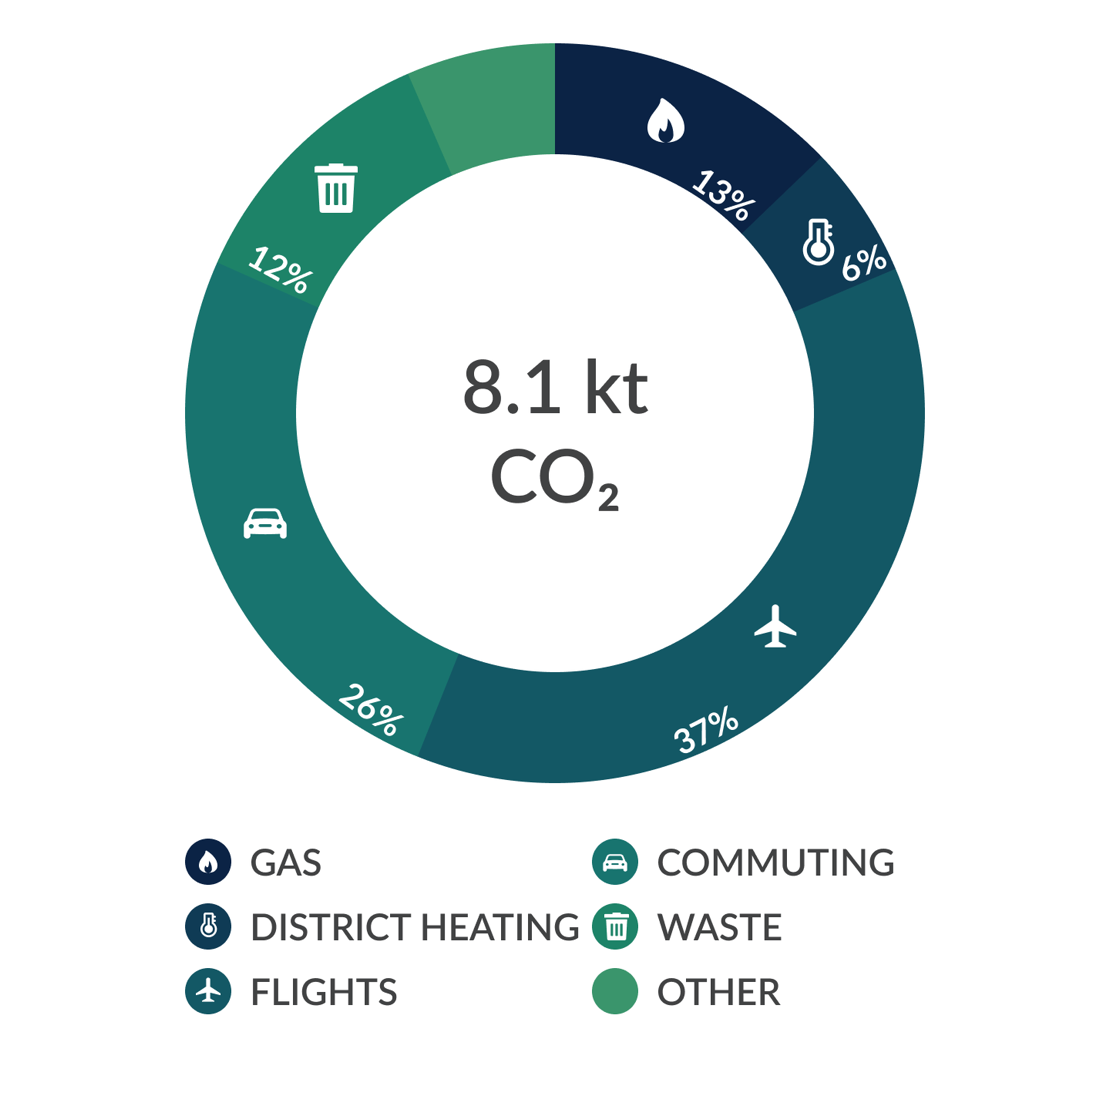
UT Carbon footprint 2023
Green electricity and VER certificates
Most of the sharp drop in emissions from 2022 onwards is a result of UT purchasing green electricity through Guarantees of Origin (GoO) since then. A large part of the increase in 2023 compared to 2022 can similarly be attributed to the fact that unlike in 2022, UT did not compensate its emissions from gas use through Voluntary Emission Reduction (VER) certificates. Without these certificates, UT’s footprint in 2022 would have been 8.3 kton, higher than our footprint in 2023.
The decision not to buy VER-certificates again in 2023 was made because while on paper such certificates reduce emissions from gas use to zero, their actual effectiveness is the subject of much discussion. Additionally, UT continues its focus on the prevention of emissions by further reducing gas use in UT buildings.
Lower gas and energy use
In 2023, UT’s gas use was reduced by 23% compared to 2022, for a total of more than 45% since 2019. This was mainly achieved by connecting more and more UT buildings to the district heating network, replacing gas as a source of heat for buildings. The biggest example in 2023 was the move of the ITC faculty from their gas-heated building in the city centre to their new building on campus, which is connected to the heating network. Most of the remaining gas use of UT is from buildings off-campus, such as Pakkerij, and air humidification in laboratories. UT is working on alternatives where possible.
Total energy use at UT in 2023 dropped by more than 9% compared to 2022, after an increase in the corona period due to increased ventilation demands. UT will continue to work on lowering its energy use, for example through making older buildings such as the Cubicus more sustainable, increased electricity generation on campus and reducing user-influenced energy use, for example in laboratories.
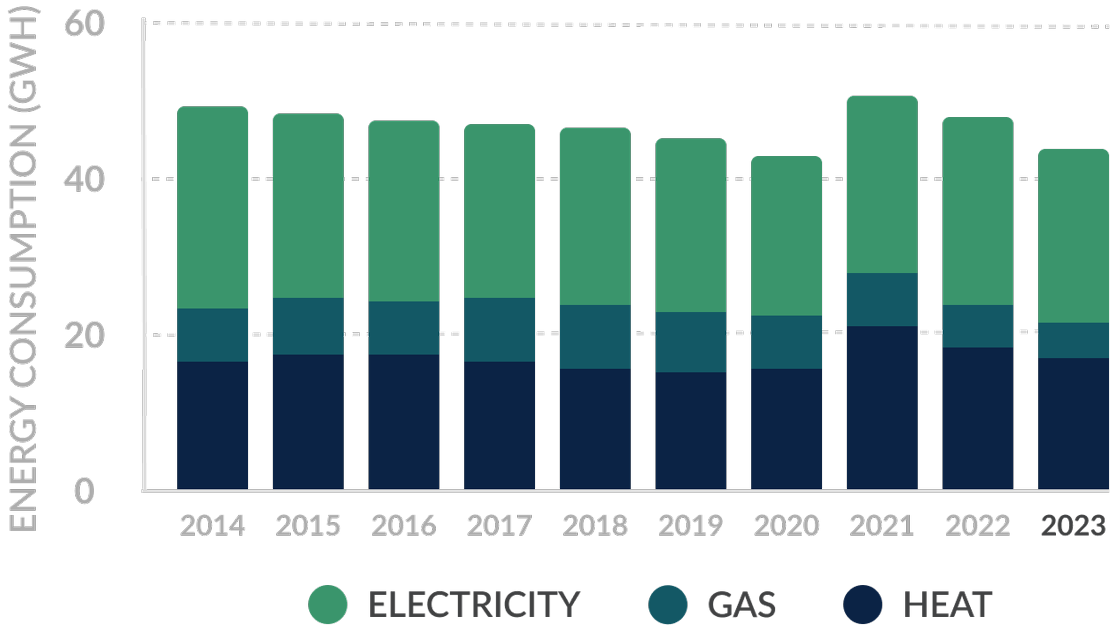
UT's total energy use 2014-2023
Business travel
The largest increase in CO2 emissions can be found in scope 3 (indirect emissions): business travel. UT staff travelled more in 2023 than they did the year before. This includes all modes of transportation: train, (electric) car, coach, and plane. Emissions from flights increased by almost 19% compared to 2022. This increase in emissions is for the most part attributable to long-range (>2500 km) flights. The increased number of flights more than compensated for gains made in other areas in scope 3. In total, flights are responsible for 37% of the total emissions caused by our university. UT continues to encourage alternative modes of transportation, such as the train through the Train Map.


