The energy transition challenge is linked to challenges of sustainable agriculture and food production, protection of nature and biodiversity, and adaptation to the changing climate. Discussions about central issues such as where to place new windmills or solar parks amongst these other societal values can become quite complex. This is where a big map table at the University of Twente can come in handy.
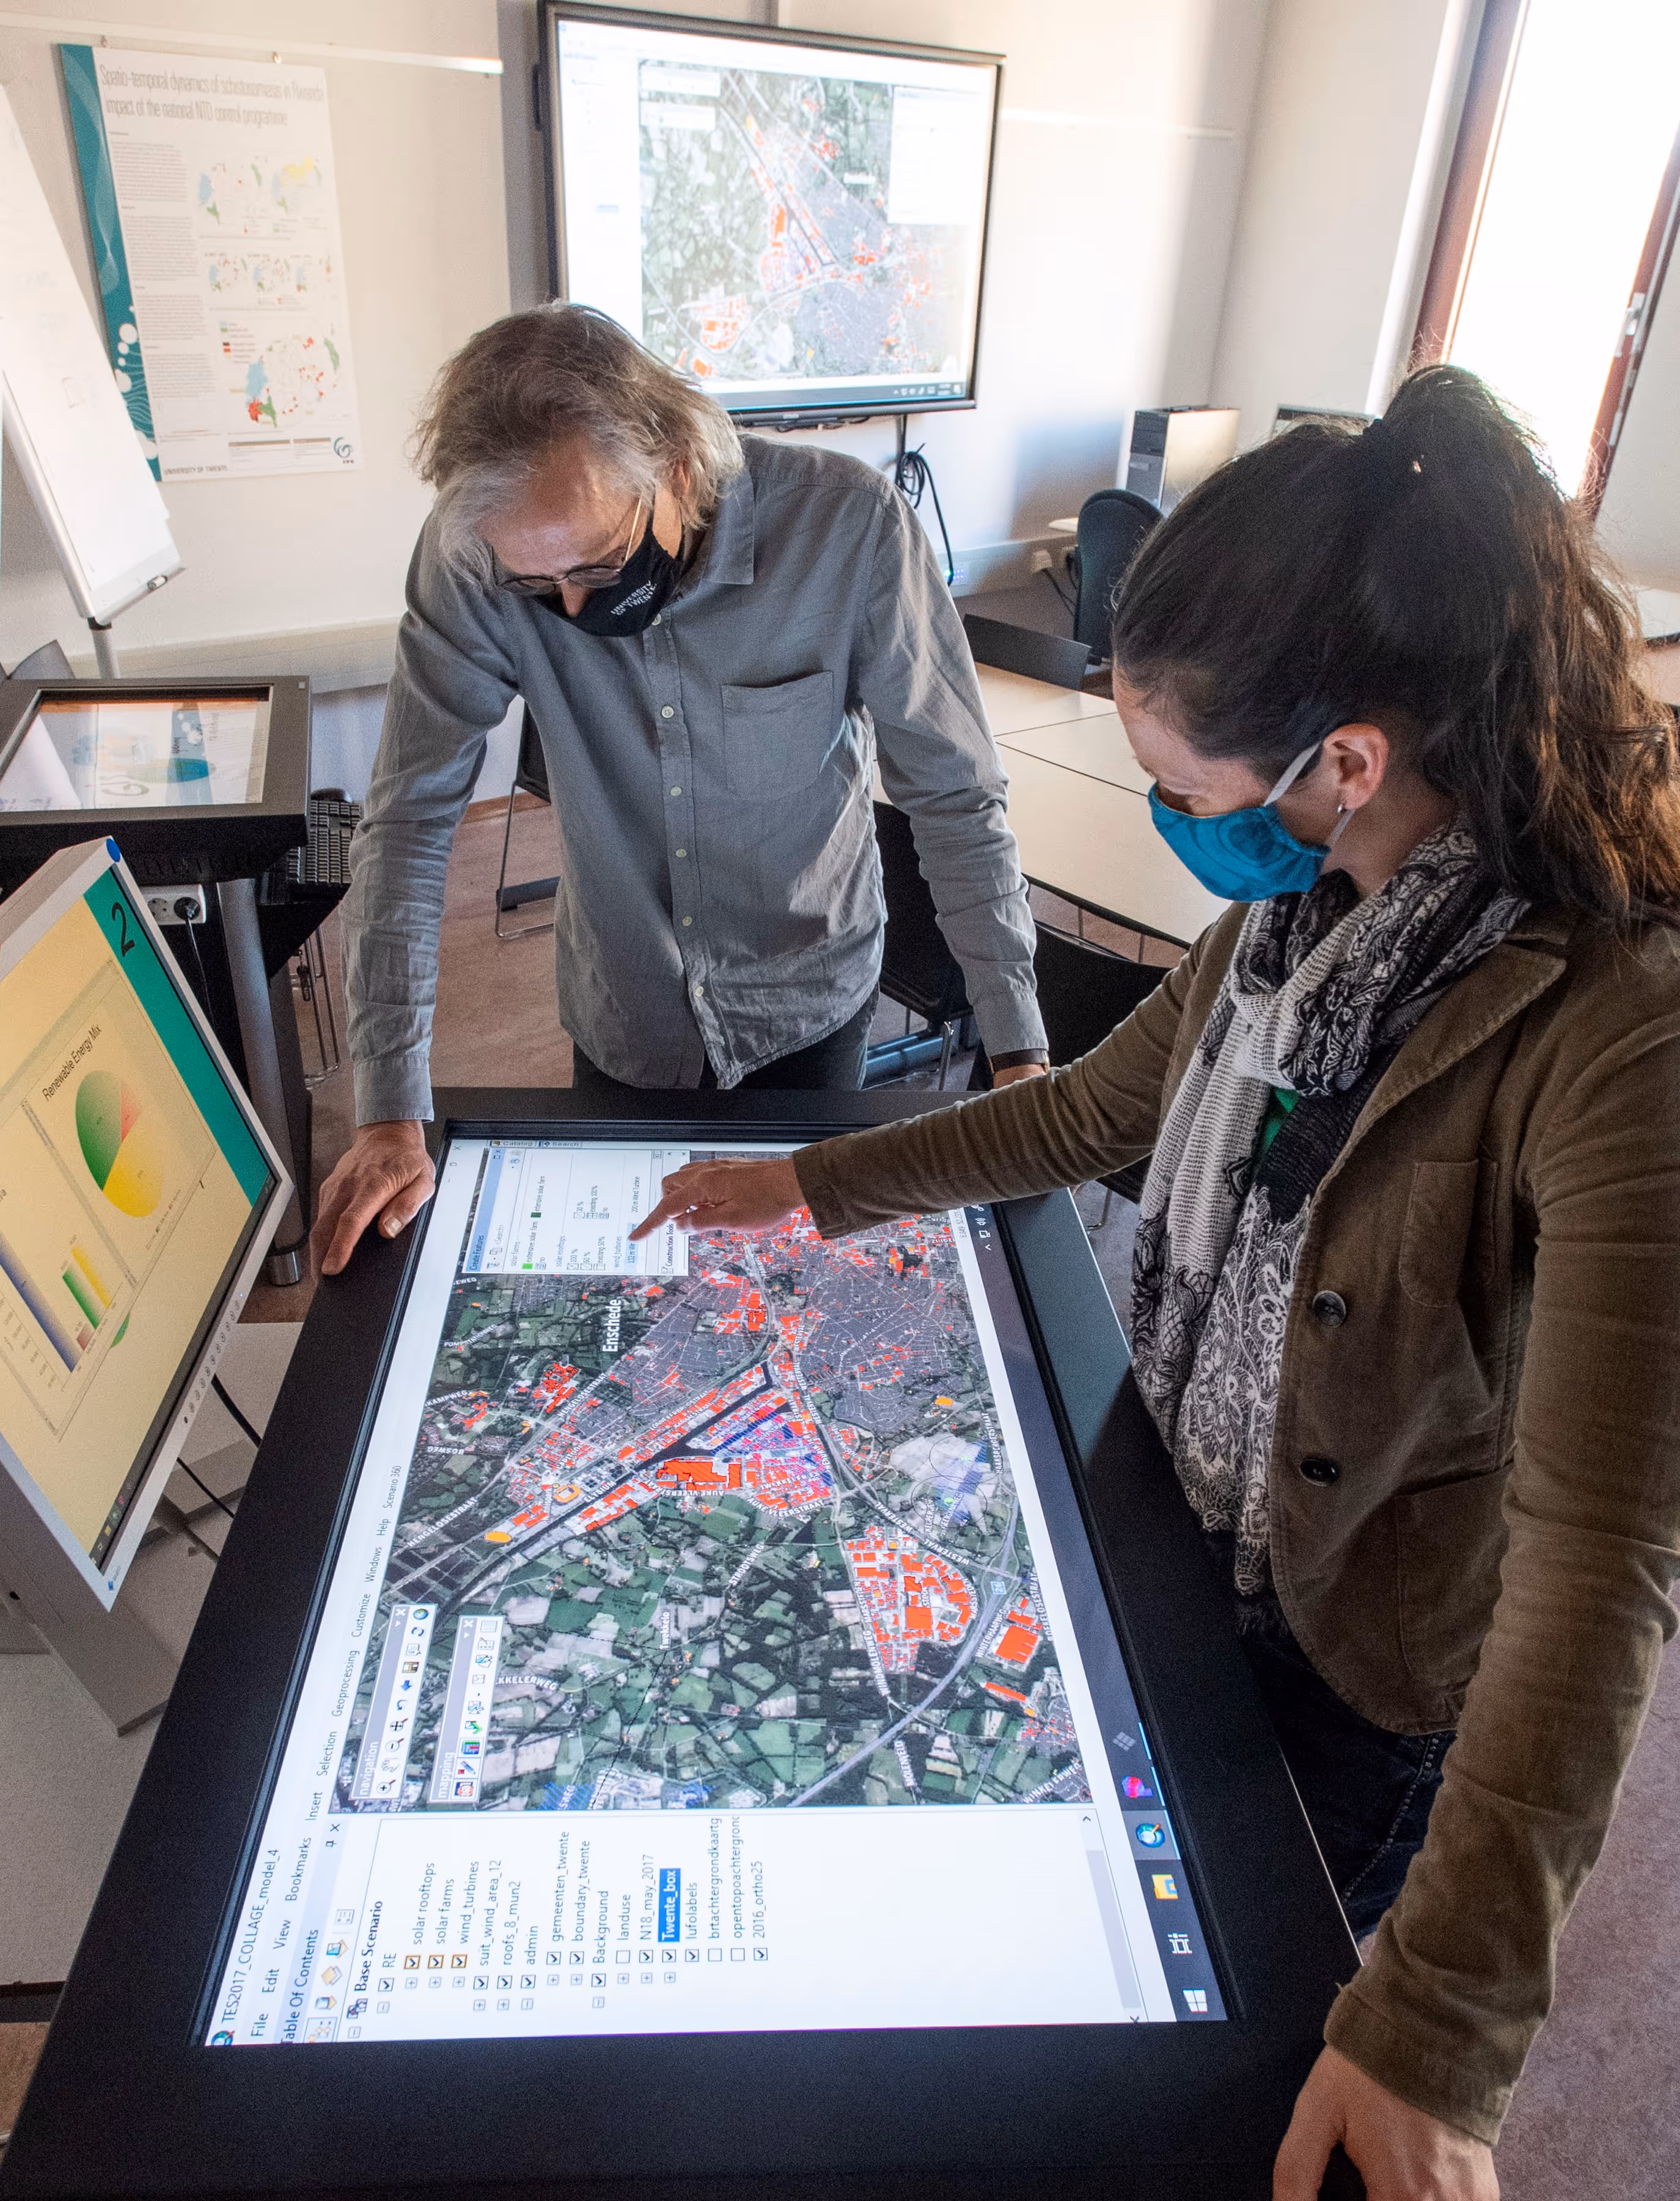
The interactive planning support system – as it’s called formally – runs the COLLAGE model. COLLAGE supports the engagement of stakeholders in planning renewable energy projects. Stakeholders come together around the interactive map table (think of a big horizontal tablet) to discuss their issues. “Our map table supports these discussions with interactive maps that show existing infrastructure, Natura 2000 areas, energy sources, urban areas and a whole lot more”, says Dr. Johannes Flacke, assistant professor at the department of Urban and Regional Planning and Geo-Information Management (PGM; Faculty ITC).
Interactive maps
The exact maps the table shows depend on the context of the discussion. “Too much information can overwhelm the process, however when planning renewable energy projects there are many perspectives to consider – balance is key” says Dr. Cheryl de Boer, assistant professor at the same department. “Many people have only a very vague idea about how energy is quantified, how much space is needed to produce it, and what the numbers used to describe this (such as Peta Joules and Kilowatt Hours) actually mean.” The interactive map table creates insight into these numbers and helps to raise awareness.
RETSI
In the NWO funded research project RETSI the researchers aim to integrate different aspects of the energy transition, together with colleagues from the Faculty of Engineering Technology and the Faculty of Behavioral Management and Social Sciences of the UT. “We strive to better support processes related to the integration of various societal challenges currently of importance in Overijssel, such as the energy transition, climate adaption and food production”, says Dr. Flacke. The challenge for the researchers is to develop a tool that can take these different (and sometimes conflicting) policies into account. “If I take certain measures for the energy transition in this area, how does it affect the food production?”
Dalfsen
As part of an EU project, the researchers originally developed the first version of COLLAGE for Dalfsen, a green community with a quite ‘ambitious’ renewable energy policy. “Not every space is equally suitable for renewable energy sources. The stakeholders were confronted with how little space there was available for the renewable technologies when they saw the spatial implications of the planned solar farms and wind turbines”, says de Boer. Interacting with the data on the map table helped them balance their energy production and energy-saving targets to be more in line with the values of their community and the natural landscape.
More information
RETSI (Regional Energy Transition as Systemic Integration) is a Dutch Research Council (NWO) project that is in progress until 31 July 2022. It is part of the research programme Societal aspects of the regional energy transition (MARET). The interactive mapping tool COLLAGE (Collaborative Location and Allocation Gaming Environment) is one of the tools available at the Group Decision Room of the ITC Faculty.
More recent news
 Thu 16 Jul 2026Veni grant for three UT researchers
 Wed 15 Jul 2026Globally unique measurements in Enschede to improve the prediction of urban heat stress
 Tue 14 Jul 2026UT professor Cristian Hesselman contributes to advice on strengthening the resilience of the Netherlands’ telecom and internet infrastructure
 Mon 13 Jul 2026From a Twente idea to a global company: Geert-Jan Bruinsma receives the Van den Kroonenberg Lifetime Achievement Award
 Thu 9 Jul 2026NWO grants awarded to four UT researchers