(January – July 2018)
Link to report in repository: http://purl.utwente.nl/essays/75381

SUMMARY
A repair card is used in aviation maintenance to report a failure or anomaly and register it in the maintenance management system. An incorrect or incomplete repair card may result in incorrect maintenance and make it very hard to analyse the maintenance data. There are several reasons for this incomplete reporting. Firstly, (part of) the information is often unknown at the moment the maintenance crew fills in the card. Also, the findings on repair cards are generally filled in as free-form text, making it difficult to automatically interpret the findings. An automatically assessed failure description will lead to more complete and consistent repair cards. This will also improve the efficiency of troubleshooting since this failure diagnosis can add information which would otherwise not be at the disposal of the maintenance crew at that time. With this research, a model is developed which is able to automatically diagnose a failure (Figure 1).
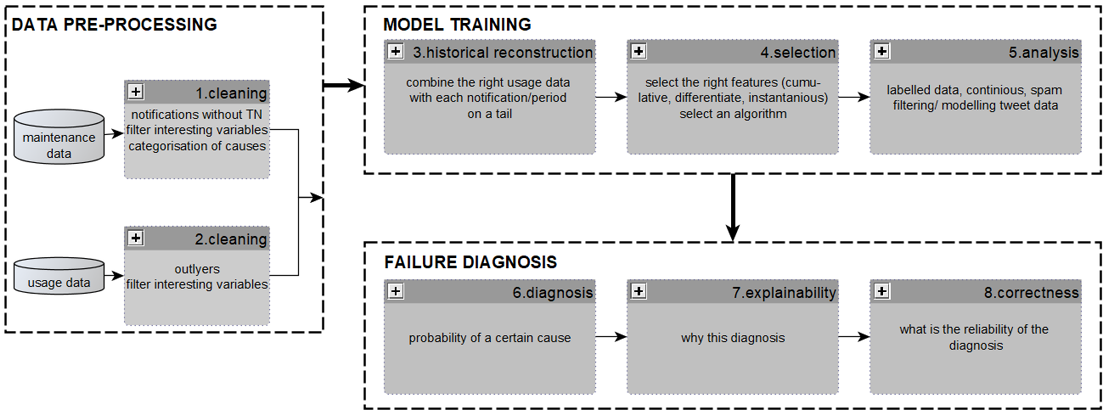
Figure 1: Functional diagram of the failure diagnosis model.
The model utilises a data driven approach, combining maintenance data and usage data. The model is based on Artificial Intelligence (AI) such that it is no longer necessary to completely understand the physics of a (sub)system or component. A newly proposed XAI (eXplainable AI) methodology, Failure Diagnosis Explainability (FDE), is added to the model to provide transparency and interpretability of the assessed diagnosis. The assessed diagnosis is explained by checking whether a new failure matches the expected values of a certain diagnosis (class). A failure is from class (diagnosis) A, because the features have similar values as class A. Contrary, this failure is not from classes (diagnosis) B and C, because the features have dissimilar values as class B and C. Two techniques are used to check whether a failure matches the expectations: visual representation and the proposed -factor. The proposed model and XAI methodology FDE are applied to a case study with a main wheel of the RNLAF (Royal Netherlands Air Force) F-16. Figures 2 and 3 show two examples of a worn and a flat tyre. For Figure 2, the tyre is worn since the red line matches most the boxes of the boxplots and the medians (visual representation) and has the lowest maximum and average (χ-factor). Contrary, this tyre is dissimilar with the expected values for a flat tyre and a tyre with other defects. The same reasoning concludes to a flat tyre in Figure 3.
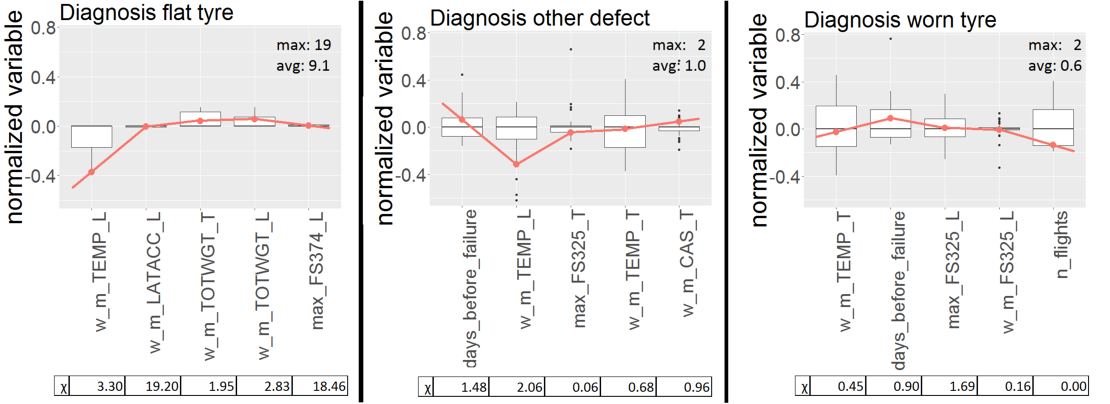
Figure 2: Explaining a specific case of a 'worn' tyre by visual representation (red line) and with the χ-factor.
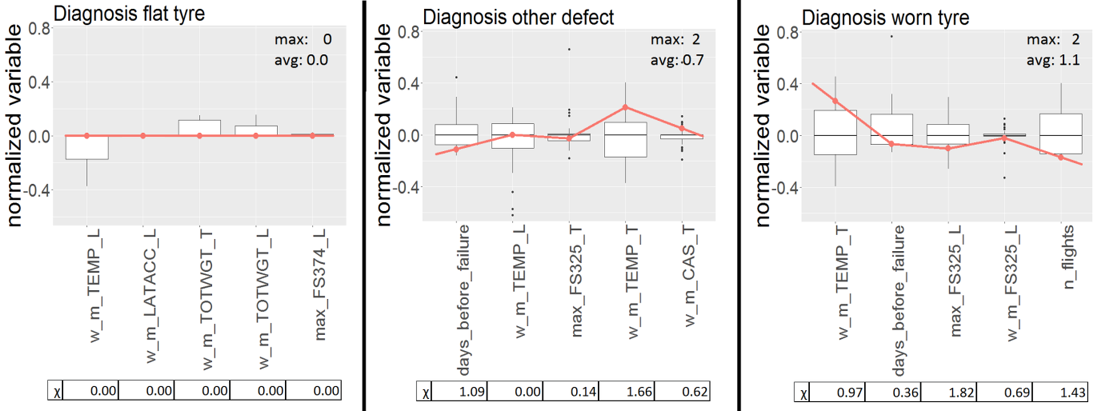
Figure 3: Explaining a specific case of a 'flat' tyre by visual representation (red line) and with the χ-factor.
This feasibility study already showed the value of this automated failure diagnosis model with an achieved accuracy of 81% of classifying a diagnosis. The proposed XAI methodology FDE was able to explain the diagnosis assessed by the failure diagnosis model both with visual representation and the -factor. Thereby the feasibility of this model is proved. This model will also support a repair shop to repair NFF (No Failure Found) components based on their historical usage.
KEY RESULTS
· A data driven model which automatically diagnosis a failure based on maintenance data and usage data using AI.
· FDE (Failure Diagnosis Explainability) is a newly proposed XAI methodology to explain an assessed diagnosis both with visual representation as with a proposed χ-factor
· A case study with the model and XAI methodology proved their feasibility with an achieved diagnosis accuracy of 81% and the ability to explain the assessed diagnosis both visually and numerically