PROJECT SUMMARY
An increasing number of non-linear equipment is interconnected via the power distribution network. A graphical representation of the equipment’s electromagnetic environment and coupling paths of electromagnetic energy is shown in Figure 1. The equipment or system should be able to function satisfactorily in its electromagnetic environment without producing intolerable electromagnetic disturbances to anything in that environment.

Figure 1 Electromagnetic environment and coupling paths of electromagnetic energy of equipment connected to the power distribution network
The area within the field of Electromagnetic Compatibility (EMC) focusing on the operation of power distribution systems including connected equipment without any malfunctioning is called Power Quality (PQ). Two entities are involved in PQ:
- the grid operator, and
- the users of electrical power.
The grid operator is responsible for the quality of the supplied voltage and the users of electrical power are responsible for the quality of consumed or produced current. This is schematically shown in Figure 2 where the Point of Interface (POI) is the physical connection between user and grid: at this point the user and grid operator are facing each other. Seen from the grid, PQ is considered as a quality of supply at the POI. Voltage supply standards (e.g. EN 50160) describe the supply of voltage and deviations. The user is supposed to fulfil the harmonized EMC standards (EMC Directive Article 6) describing the immunity and emission parameters of the connected user. The network of the user is called Power Distribution User Network (PDUN).
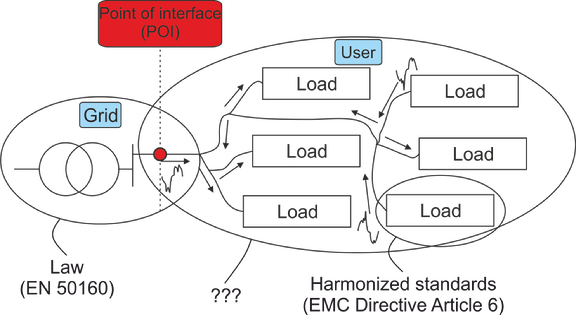
Figure 2 Interaction between equipment via conducted interference in the PDUN, where the PDUN is neither covered in voltage supply standards (=law) nor in EMC standards describing the immunity and emission parameters of the connected user (= harmonized standards)
The standards for supply and consumption do not match and furthermore do not cover the PDUN. These standards were developed at the time linear (resistive) consumers dominated the overall load in power distribution networks. The connection of large numbers of nonlinear equipment is not covered. As a result the models used in the traditional power system analysis methods do not capture associated interference effects and therefore the conventional approach of displacement factor and low frequency description is not sufficient anymore. In other words, there is a need for requirements on the voltage quality and current quality inside the power distribution user network reflecting interaction between voltage and current.
Integrity of waveforms
Many PQ problems are observed in professional applications, with many different products and systems in a complex environment like production plants, large buildings, offshore platforms but also the residential environment. An example is synchronization effects of low power equipment which is shown in Figure 3, where the numbers in brackets refer to values of equivalent incandescent lamps for LED (Light Emitting Diode) and CF (Compact Fluorescent) lamp. Non-linear low-power equipment draw currents during a short period of time resulting in distorted current waveforms; non sinusoidal current waveforms. These distorted current waveforms give rise to distortion in voltage waveforms. The voltage waveform is a function of impedance of PDUN and current, essentially, Ohm’s law, but the current waveform is also a function of the voltage waveform. Dramatic increasing harmonic levels are observed in PDUNs. Figure 4 shows an example of an overloaded transformer feeding a modern PDUN.
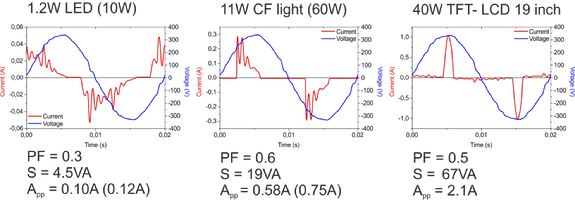
Figure 3 Waveforms low power loads affected by synchronization effects
(numbers in brackets refer to values of equivalent incandescent lamps)
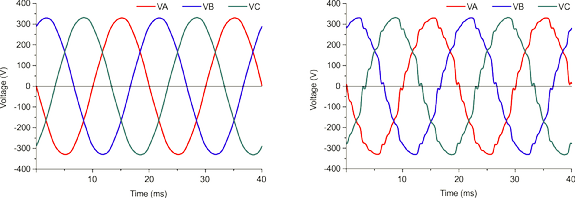
Figure 4 Voltage waveforms transformer without load (left) and same transformer with load (right)
Another example is the disturbance of a 50 kW solar power installation (or Photovoltaic (PV) system) by a Power Drive System (PDS) feeding a ventilation system. During periods with sunshine the PV system is malfunctioning and less power is generated. This to the dismay of the owner! As shown in Figure 5, the PDS gives rise to increased noise power in the frequency band from 2 kHz to 150 kHz. This frequency band is not covered in civil standards: upto 2 kHz power harmonics are considered and from 150 kHz upwards protection of radio applications starts.
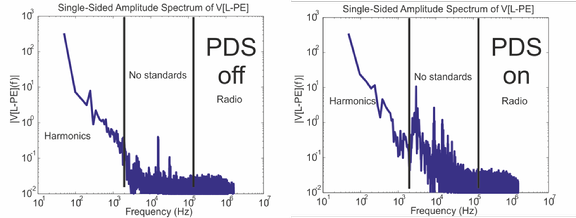
Figure 5 PDS for a ventilation system causes a significant increase in conducted emission in the uncovered frequency band from 2 to 150 kHz.
PDUN impedance
The severity of these observed phenomena depends on the broadband PDUN impedance and the dynamic broadband behaviour of connected equipment. An example of measured line impedance registered at different locations within a PDUN is shown in Figure 6. This means that the description of the generic network impedance as defined in IEC 60725 is too limited. The impedance is defined for fundamental frequency only as 0.24 + j0.15 Ω for phase and 0.16 + j0.1 Ω. An extension is found in the application of Artificial Mains Networks (AMN) and Line Impedance Stabilization Networks (LISN). These are used for interference measurements to provide defined impedance at the terminals of the Device Under Test (DUT). The covered frequency bands start at 9 kHz and end between 10 to 100 MHz for AMN (CISPR 16) and start at 30 Hz and end at 10 MHz for LISN (MIL-STD 461 Revision E and F). These standardized networks represent the impedance between phase and reference or neutral and reference as seen by the DUT.
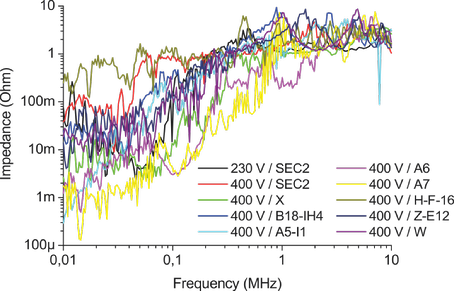
Figure 6 Line impedance measured at different locations within a PDUN
The equivalent impedance of the standardized networks is a single circuit with lumped components. An AMN or LISN is basically a capacitor at low frequencies, a resistor (often 50 Ω) for high frequencies and an inductor, which represents the power cables, for medium frequencies. An example of an LISN with sketch of its impedance is shown in Figure 7, where EUT stands for Equipment Under Test.
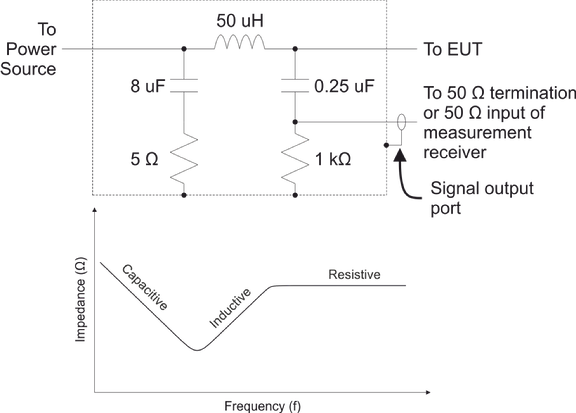
Figure 7 Schematic 50 μH LISN, as in MIL-STD 461 Revision E and F with a sketch of its impedance as seen by equipment.
The cable length as well as the considered frequency range determines the components, as series resistance, series inductance, shunt conductance and shunt capacitance, to be modeled and the values of those components. These are extracted from transmission line equations. When the electrical length of the cable is long, the cable is then modeled by distributed lumped element circuits where each sub-circuit is electrically small.
Equipment behavior
Gray box models are developed, describing the steady state behavior of nonlinear equipment taking into account synchronous switching effects. The models are developed for two kinds of nonlinear loads commonly found: a load with a rectifier bridge without Power Factor Correction (PFC) and a load with a rectifier bridge with active PFC. The first Device Under Modeling (DUM) is a CFL and is shown in Figure 8. The second DUM is a Switch Mode Power Supply (SMPS) for a PC and is shown in Figure 9. The models contain only information of the design of the DUM as far as it is relevant to the behavior observed at the terminals. Therefore they can represent a diversity of loads. As the models are based on simple basic components commonly found in loads they do not need considerable intellectual properties and time consuming computer resources.
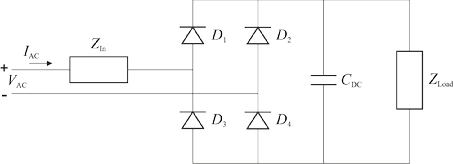
Figure 8 Model for CFL (no PFC)
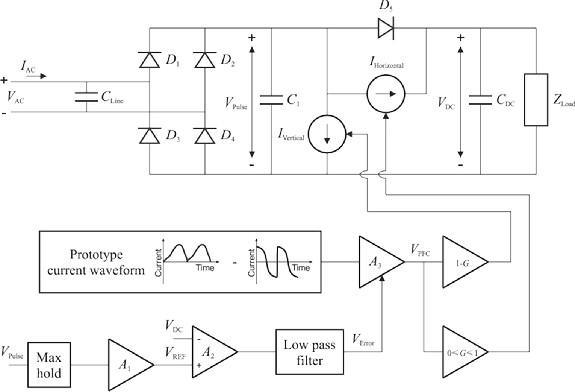
Figure 9 Model and simulation results for PC (active PFC)
The electrical components commonly found in loads similar to the DUMs, like diode bridge and capacitor feeding DC bus, are used in the gray box models. Current sources controlled by prototype current waveforms represent the active PFC. To maintain a satisfactory accuracy several prototype currents under different conditions might be necessary. Parameterization of the models is done by measurements on the PDUN interface of the DUM, see Figure 10, which are captured into parameterization scripts. The model parameters can be found without opening and examining the loads (i.e. “black box”).
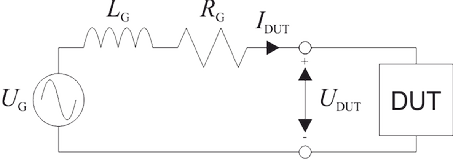
Figure 10 Measurement setup for parameterization of DUM and validation of the model
The simulation results are shown in Figure 11 and Figure 12. The developed gray box models produce simulation results being close to the measurement results, while being computationally light.
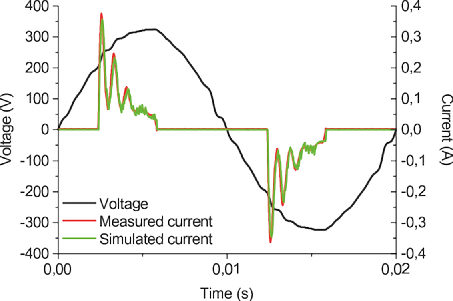
Figure 11 Simulation results CFL (no PFC)
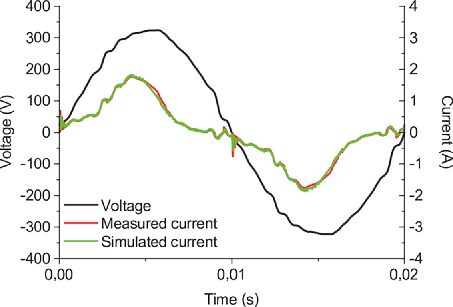
Figure 12 Simulation results PC (active PFC)
CONCLUSION
Macro models can be created from the developed gray box models to use them in simulation tools. Then, the macro models together with the models for the infrastructure of the PDUN can be used in simulation tools to simulate large groups of loads. Based on the obtained results, the models for the infrastructure of the PDUN and the developed gray box modeling with parameterization scripts can be converted into design tools for PDUNs.
By combining the broadband models for the infrastructure of the PDUN and broadband behavior models for the nonlinear equipment, one has the basics for simulating the interaction between voltage and current in the PDUN, for example, synchronization effects of low power equipment.
Although the simulation tools are not available yet, the concept can be illustrated as shown in Figure 13 and Figure 14. For this purpose, a simplification is made by not considering variations in loads and voltage drop over the cable sections. Similar loads are connected at one point in Figure 13. Since every load is supplied by the same voltage, all the loads draw the same current at the same time. Therefore all spectral current components will add up. When loads are connected to a long cable, there is a distance between the connection points of the loads as shown in Figure 14. This is modeled by including lumped elements circuits representing the cable distance between the loads. Each cable section represents a propagation delay. For low frequency components these propagation delays are relatively small and the spectral components will add up. For higher frequency components, the propagation delays become relatively large, resulting in diversity of these components. Diversity is also a function of variation in products and voltage drop over cables, but this can be included in the models. This means that diversity could be modeled.
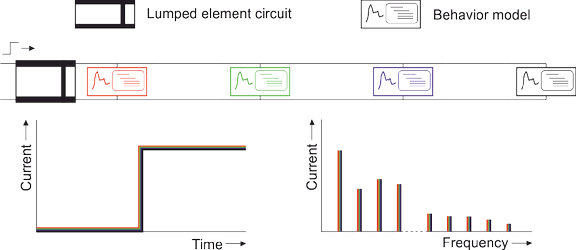
Figure 13 Application of the modeling concept: similar loads connected in parallel at one point
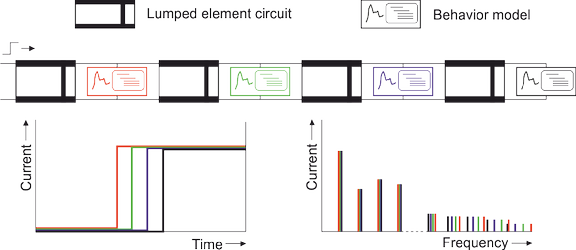
Figure 14 Application of the modeling concept: similar loads distributed along cable
PROJECT PARTNERS
This project was supported by Dutch Ministry of Economic Affairs, Agriculture and Innovation, Agentschap NL project number EMVT 08113 (duration: 01-04-2009 till 01-04-2013).
Related publications
Click here for publications in e-prints which are related to the project.