‘I like to pick up complex mathematics, using it to solve problems for companies and indirectly for society.’

With this bachelor's programme Applied Mathematics, you will not become a maths teacher, but someone who can turn social problems into a maths puzzle and solve it. To share my passion for mathematics, I have been active during my student days to educate about this great course.
Making scans sharper via imaging
During my master's in Applied Mathematics, I chose Christoph Brune's specialisation (now called: Mathematics of Data Science). Here, I worked on a graduation project to model, implement and test higher-order variational methods for photoacoustic tomography. Photoacoustic tomography is a new imaging method used in the diagnosis of breast cancer and rheumatoid arthritis. The challenges in this tomography problem are on the one hand getting rid of noise and on the other hand, reconstructing an image with a limited amount of data.
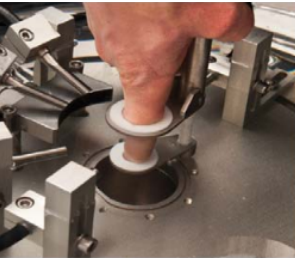
Image: Photoacoustic tomography system. This image shows the photoacoustic tomography system measuring a human finger to detect incipient rheumatoid arthritis.
Because of the noise and limited amount of data, a scan is not always useful for making a diagnosis. For example, if you try to image a joint inflammation, you will see this by discolouration around the joints, but these are also exactly the places where it is difficult to get a sufficient image and distinguish the signal from the noise.
By using imaging techniques, among others, the photo can be made sharper and the physician can better assess whether there really is inflammation in the joint. That inflammation could be an early indication of rheumatoid arthritis. This is a great way of deploying mathematical models for society.

Scans without noise, on which you can zoom in ad hoc on problem areas, allowing doctors to diagnose on the spot.
I chose to do a PhD after my master's degree. The CWI offered me an opportunity to do so. The PhD project aimed to obtain moving 3D images from a CT scanner, so that patients do not have to lie still and could even move while a scan is being made. This project was part of a larger research project I worked on with two other PhD students (Allard and Jan-Willem). Allard worked on Machine Learning, Jan-Willem did Scientific Computing, and I dealt with mathematical and physics models. By combining our areas of expertise, we were both able to create a mathematical model that produces moving 3D CT images and provide software that allows you to zoom in on the live scan. This makes it easier for a physician to make an immediate diagnosis when it may not initially seem clear on the scan. You can imagine that this will allow physicians to start a treatment plan faster, as the CT scan doesn't need to go over again.
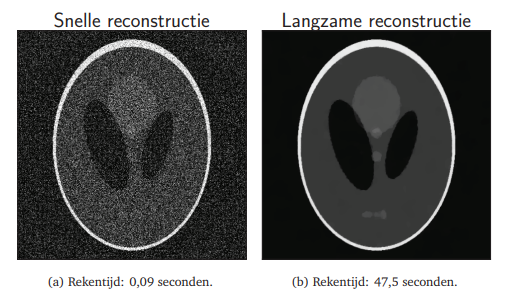
Figure: Two different reconstruction methods applied to computer-simulated CT measurements with a lot of noise. On the left is a fast method, which handles noise on the data poorly, and on the right is a slow smart method that can handle the noise well, but is too slow to calculate live images with. To see how these models are combined into a model that produces sharp images in a fraction of the time, you can read further in my thesis: Automatic and efficient tomographic reconstruction algorithms.

Digitising the map of the Netherlands for Het Kadaster
Now I am a ‘Mathware Engineer’ (mathematical consultant and also providing software) within Sioux Technologies. We help companies design mathematical solutions to their practical problems. I work in the maths and physics department, but Sioux Technologies has departments for all technical subjects and studies.
Nowadays, I am working on an assignment from The Land Registry (Het Kadaster): digital mapping of the Netherlands. This project aims to combine all measurements ever taken (since 1850) in the Netherlands by the Land Registry with all existing maps, into a large accurate map of the Netherlands. The challenges here are, on the one hand, digitising the measurements - because only since a few years ago these measurements have been digital - and, on the other hand, trying to find the overlap between these measurements and the existing maps. You can imagine that if two measurements show the same lamppost of the Hengelosestraat you then know how these measurements should be relative to each other. We then think of this as a constraint of the map. If you then have a set of constraints together, you can compute the best way to position all the measurements in the map by making an optimisation problem of it and solving it. This problem is manageable if you would do it for the Campus, but if you want to calculate the whole of the Netherlands, you have billions of constraints and a challenging big-data problem which cannot be solved in one go. Our work is now focused on accurately calculating this problem and proving how we split the problem actually produces the correct solution.