MAPPING ROOT WATER UPTAKE STRESS AND CARRYING CAPACITY USING SATELLITE OBSERVED SOIL MOISTURE DATA
The waterboards’ responsibility for freshwater availability is managed by monitoring surface and ground water levels. These levels are influencing the soil moisture content in the soil, which is an important parameter for crop growing (root water uptake stress) and the carrying capacity. Knowledge of the soil moisture content can improve the management of the available water resources. In this research the soil moisture is retrieved from satellite observations and used to quantify the carrying capacity and root water uptake stress.
Soil moisture is inhomogeneous over an area and can change rapidly in time due to atmospheric forcings and irrigation. Therefore fine resolution spatial and temporal soil moisture data are needed. These data are produced by downscaling low spatial and high temporal Advance SCATerometer data (ASCAT, 12.5 km x 12.5 km, 1 day) with high spatial, low temporal resolution satellite data (RADARSAT-2, 25 m x 25m, 24 days). Four downscaling methods are applied. The method which uses a daily changing soil sensitivity parameter (β) shows the best fit between in-situ observed and satellite retrieved soil moisture data.
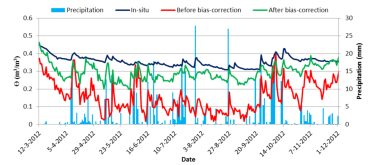
Figure 1: In-situ observed and satellite retrieved volumetric soil moisture content before and after bias correction for the location ITCSM 10. After bias-correction R2 = 0.43 and the MAE = 0.06 m3/m3.
Maps of the retrieved soil moisture data show wet and dry areas at the expected locations. The soil moisture values are transformed to a soil status using the Soil-Moisture-Stress indication (SMS-i) diagram, developed for each soil type of the Policy Analysis of Water Management for the Netherlands (PAWN) classification and consisting of the combination of water or oxygen stress for root take up and the carrying capacity (Figure 2).
Results show a strong correlation between the soil status soil type. This is because i) each soil type has its own unique SMS-i diagram based and ii) the coarse resolution satellite data have to be multiplied by the porosity of the soil to obtain the volumetric soil moisture content. Because the used soil map, based on the PAWN classification, has only 21 soil types for the Netherlands, soil properties are averaged and spatial heterogeneity within soil types is neglected. This research has shown that satellite retrieved data can be used to produce fine resolution soil moisture maps which can be translated to classes indicating the root water uptake stress and the carrying capacity. However, the average Mean Absolute Error (MAE) of 0.08 m3/m3 over all grass covered in-situ stations after validation is high compared to the average porosity of 0.42. Accuracy and reliability of the retrieved maps should be improved to make them useful for operational water management.
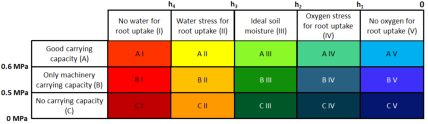
Figure 2: General Soil Moisture Stress indication (SMS-i) diagram. |