Researcher: Rob van Iddekinge
Project Duration: October 2019 – August 2020
Project Partner: RWS
Research Summary:
The functional performance of viaducts plays an important role in replacement decisions at Rijkswaterstaat. Previous research has established performance indicators, which are used to determine the functional performance. These are traffic flow, geometry, load-bearing capacity, safety and noise emissions. However, it is complex to determine the functional performance of viaducts and roads, because data sources are fragmented. Therefore, this research aims to develop a spatial decision support tool that integrates these data sources and visualizes the functional performance on a 4 point scale (perfect, good, fair or poor) for viaducts and road sections.
This research is design oriented and therefore, the methodological approach taken in this study is mainly a combination of systems engineering and the design cycle within design science. The main structure is divided into requirements, design and verification & validation. Based on a problem statement and research methods the requirements have been defined. This leads to a design solution which has been verified and validated. Additionally, some parts of the design need input from empirical research. The research is qualitative in nature and uses literature, workshops, unstructured interviews and a questionnaire as research methods.
The first results are the requirements for the design of the tool, which are divided into three categories: data, visualizations and interaction. Examples of requirements are:
- The tool should integrate the data.
- Data should be easy to interpret by decision-makers (visualizations).
- Users should be able to select a viaduct and see the data (interaction).
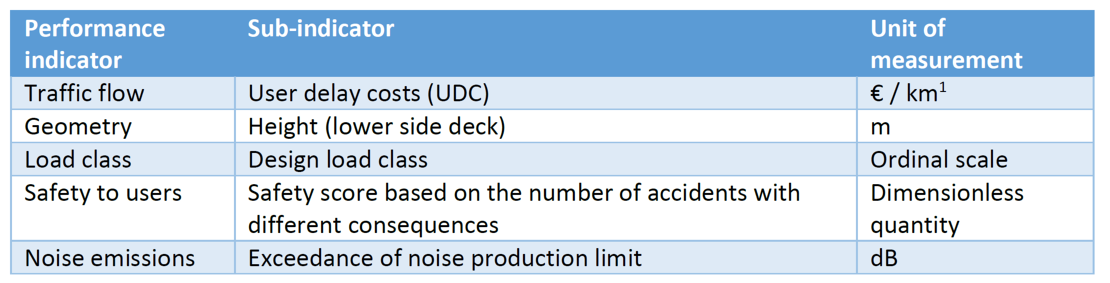
Subsequently, the existing performance indicators have been linked to sub-indicators. This is needed because the existing performance indicators from previous research are not always specific enough that they can be linked to data sources. The sub-indicators are shown in Table 0.1.
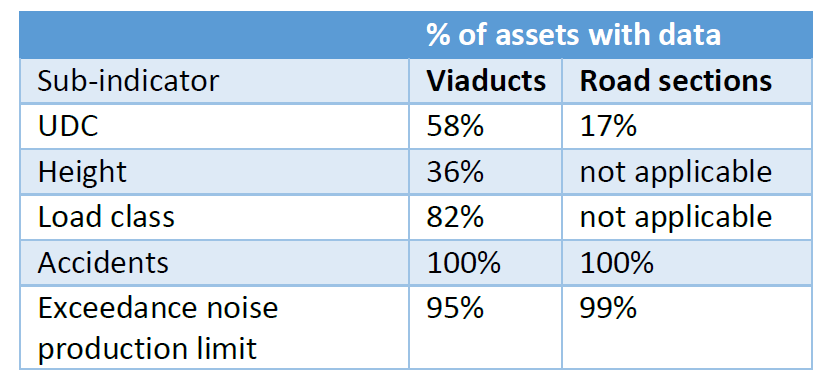
The choice for a certain sub-indicator is also based on data availability, so that each sub-indicator is assessed based on a data source. These data sources have been linked to viaducts and road sections. This is a design step and has been executed based on a common attribute or spatial location of the data sources. The eventual dataset contains 3521 viaducts and 16591 road sections. However, it is not possible to link all data to all assets. Table 0.2 shows the percentages of assets with data for each sub-indicator. For viaducts, the height dataset has the highest amount of missing data.
Table 0.2: Percentages of available data, divided by sub-indicator and type of asset (viaducts and road sections).
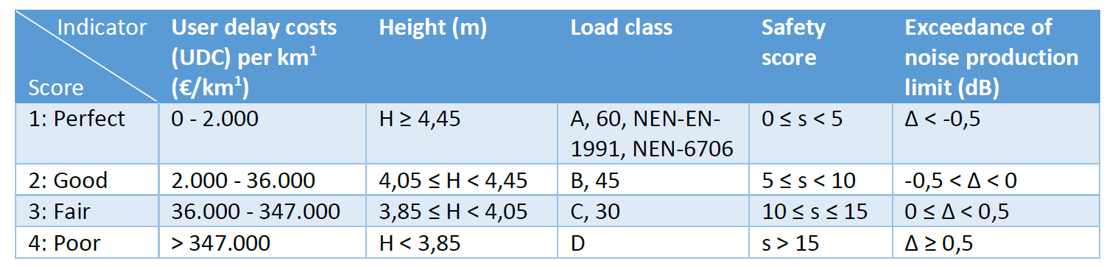
The next result is the division of data into score categories. The score categories are an ordinal scale and can either be perfect, good, fair or poor (see Table 0.3). This is also implemented in the tool, so for each sub-indicator the score has been defined based on the data. When data is missing, the score for that sub-indicator is set at ‘0’. The worst score is leading for the overall functional performance of a viaduct or road section.
Table 0.3: Overview of score categories per indicator.
The final part of the design consists out of the visualizations, which lead to the design solution. This has been done using ArcGIS online. Used visualizations within the tool are colors, bar charts and pie charts. Figure 0.1 shows the spatial decision support tool, where a green color indicates a perfect score, yellow a good score, orange a fair score and red a poor score.
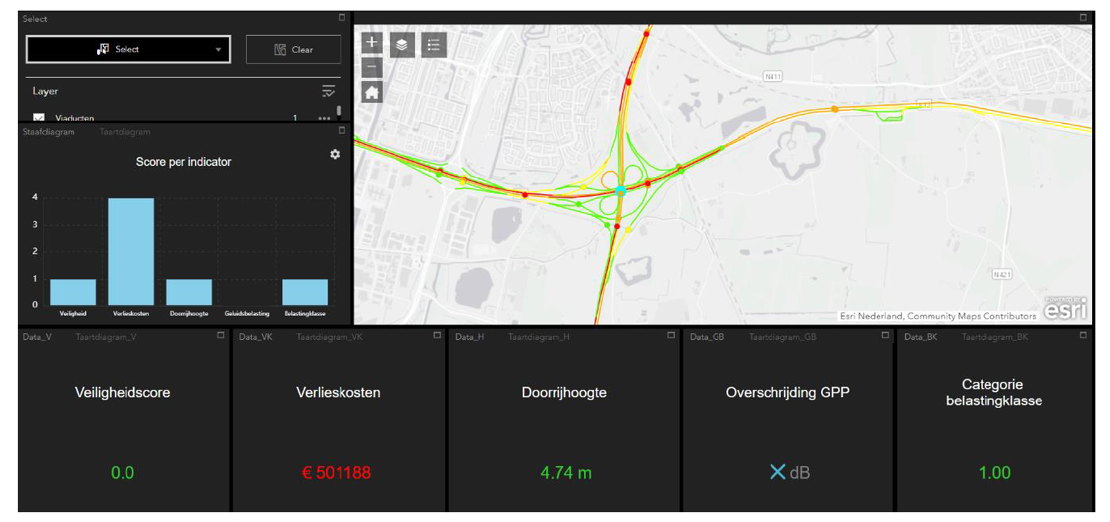
Figure 0.1: Screenshot of the tool. The dots indicate viaducts, the lines indicate road sections. The visualizations on the bottom and at the left side show the score of one selected viaduct.
During verification, the design solution has been compared with the requirements and explanations have been given how the design satisfies the requirements. Validation has been done in an online workshop, where the sub-indicators have been explained and the tool has been demonstrated. Respondents confirmed the relevance of the tool within replacement decisions and found the integration of data a valuable contribution. Most suggestions for improvements concern the used sub-indicators and the division into score categories. A few suggestions have been implemented in the tool, which leads to the final design solution. Further work is required to enhance data availability at Rijkswaterstaat which will enable that better sub-indicators can be used and will foster the coverage of the data. Another important issue for future research is how to move from the functional performance to a replacement decision. These suggestions will help Rijkswaterstaat to implement the functional performance earlier and more integral in the decision-making process of replacement of viaducts and road sections.