How to use this Guide
This guide supports you through the process of answering your question. It might help if you first write down all of your questions. After, have a look at the overview. Which parts of the guide might be useful for you? Go through all of these pages and see if you can find an answer.
Please make sure to follow this step-by-step guide before you schedule a consult! Additionally, you can have a look at our FAQ page. Maybe somebody asked the same question as you. If both the guide and the FAQ can't answer your question, you can schedule a consult with us. The link for the schedule planner can be found under Step 4: Schedule a Consult.
P.S. Here is a link to the book that is used in your data analysis courses. Take a look there, too!
1. Getting started
Guide on how to write your research
This is the ‘Research Methods Tool Box’, which helps students to conduct research.
NEW: More micro-lectures that can assist you throughout the research process can be found here.
It also may help supervisors to instruct their students.
Following questions are given attention to:
The research methods toolbox is developed by the Henk van der Kolk, Rory Costello …***
The toolbox makes substantial use of:
Trochim, William M. The Research Methods Knowledge Base, 2nd Edition. URL: https://www.socialresearchmethods.net/kb/
How to construct a questionnaire
QUESTIONNAIRE CONSTRUCTION
In this section, you can find information that can help you to construct your questionnaire. We have a number of videos that help you with constructing your survey and that help you construct your scale. Additionally, you can find information on how to prepare your data after data collection and further information on psychometric tests and questionnaire tools like atlas.ti.
Construction of a survey and scale
Videos about the construction of a survey:


Videos about what to pay attention to when constructing a scale


Preparing data for further ANALYSIS
Videos about the data of a questionnaire
Coding of the variables and the data matrix
Coding of multiple variables and open-ended questions
What do you do with missing data en how do you check data?
Psychometric Tests
An introduction in psychometric tests.
Do you want to calculate the cut-off in a psychometric test? You can use the receiver operating characteristic analysis gebruiken and you can read more about that here.
Atlas.TI
Do you use ATLAS.ti for your qualitative research? See here how you should do that.
APA Guides
APA
Here you can find a selection of websites that can help you to write your research in line with APA guidelines:
- For the layout of your article (headings, font, tables & figures), see this website of the American Psychological Associaton (APA).
- For how to format your reference list, see example references on the APA website.
- For in-text citations, see examples here on the APA website.
- For an example report, visit this APA website.
- For numbers and statistics, see the APA's guide on reporting numbers and statistics.
- For more information have a look at the official website of APA!
2. Analysing your data
3. Statistical softwares
Depending on when you started your studies you learned statistics either with the software SPSS (starting your Bachelor before 2020) or with R (starting your Bachelor in 2020 and later). Find below the most important commands for either software:
R
Basic code structure for Linear models
Linear models with numeric dependent variable and no clustering variable
| Linear model used | Relevant chapters | Code |
|---|---|---|---|
Comparing two means from two independent samples | Linear model with
| Chapter 6 |
|
Comparing more than two means from independent samples | Linear model with
| Chapter 6 | If x is a factor variable
If x is stored as a numeric variable
|
Testing the interaction effect of two categorical variables on a numeric dependent variable | Linear model with
| Chapter 9 | If x and z are factor variables
|
Testing the interaction effect of two numeric variables on a numeric dependent variable | Linear model with
| Chapter 9 | If x and z are numeric variables
|
Testing the interaction effect of one independent numeric variable and one numeric dependent variable | Linear model with
| Chapter 9 |
|
Regression | Linear model with
| Chapter 4 and 6.5 |
|
MODELS WITH A NUMERIC DEPENDENT VARIABLE AND A CLUSTERING VARIABLE (DUE TO REPEATED MEASUREMENTS)
New approach | Relevant chapters | Code | |
|---|---|---|---|
Comparing two means from two related samples | Linear mixed model with
| Chapter 12 |
|
Comparing more than two means from related samples | Linear mixed model with
| Chapter 13 |
|
MODEL WITH A DUMMY OR A COUNT DEPENDENT VARIABLE
New approach | Relevant chapters | Code | |
|---|---|---|---|
Logistic regression | Generalized linear model with
| Chapter 15 |
|
Testing the independence of two categorical variables | Generalized linear model with
| Chapter 16 |
|
Manuals & Websites
Please keep in mind that when working with R it is normal to search for the specific codes needed.
The UT provides a manual with different R codes for several types of analyses. It is mainly aimed at codes used in the statistics courses of several Bachelor programmes but can be a good starting point.
If you need information on how to analyse data using linear models you can have a look at this book.
If you have questions regarding Bayesian statistics please have a look at this book. It also provides information on how to set up R and how to install libraries from cran but also other sources.
SPSS
BASIC SYntax STRUCTURE FOR LINEAR MODELS
Linear models with numeric dependent variable and no clustering variable
| Linear model used | Relevant chapters | Syntax |
|---|---|---|---|
Comparing two means from two independent samples | Linear model with
| Chapter 6 | If x is a dummy variable
If x is not dummy-coded
|
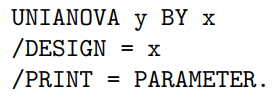
Comparing more than two means from independent samples | Linear model with
| Chapter 6 |
|
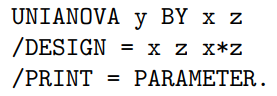
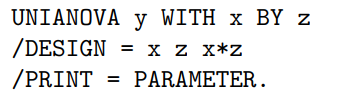
Testing the interaction effect of two categorical variables on a numeric dependent variable | Linear model with
| Chapter 9 |
|
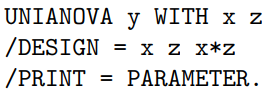
Testing the interaction effect of two numeric variables on a numeric dependent variable | Linear model with
| Chapter 9 |
|
Testing the interaction effect of one independent numeric variable and one numeric dependent variable | Linear model with
| Chapter 9 |
|
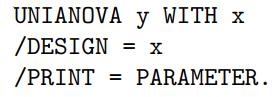
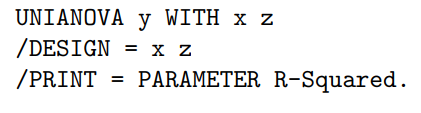
Regression | Linear model with
| Chapter 4 and 6.5 |
|

Models with a numeric dependent variable and a clustering variable (due to repeated measurements)
New approach | Relevant chapters | Code | |
|---|---|---|---|
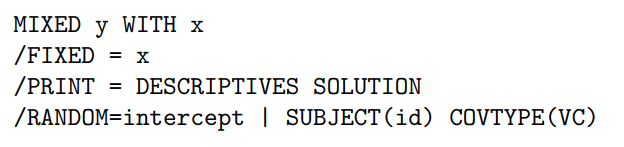
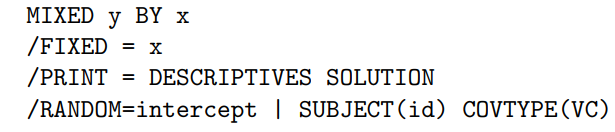
Comparing two means from two related samples | Linear mixed model with
| Chapter 12 | If x is a dummy variable
If x is not dummy-coded
|
Comparing more than two means from related samples | Linear mixed model with
| Chapter 13 |
|

Model with a dummy or a count dependent variable
New approach | Relevant chapters | Code | |
|---|---|---|---|
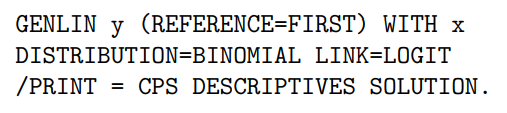
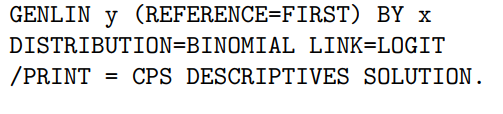
Logistic regression | Generalized linear model with
| Chapter 15 | If x is numeric or dummy-coded
If x is a non-dummy categorical variable
|
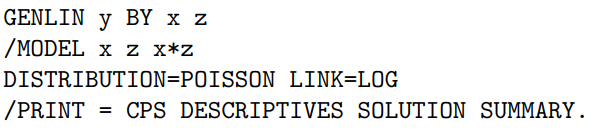
Testing the independence of two categorical variables | Generalized linear model with
| Chapter 16 |
|
The general commands useful to analyse data using linear models are
Linear model | UNIANOVA |
Linear mixed model | MIXED |
Generalized linear model | GENLIN |
Further information
Here you can find some useful websites that explain how to carry out certain analyses in SPSS.
SPSS tutorials | The Ultimate Guide to SPSS (spss-tutorials.com)
The website below is very useful but the full package costs. Therefore, there is no overview page of all available statistical tests and how to perform these in SPSS. Below you find an example page for a regression analysis. For all other statistical tests, please use google to see whether statistics.leard has a manual available for free.
Finally, this website provides a theoretical overview of different tests and how to conduct these in SPSS. Just type the test you would like to use into the search bar.
4. Schedule a consult
When to make an appointment
If you still need additional support after you followed our step-by-step guide, the methodology shop offers help via email and in the form of an online consult. A consult is often preferred over an email, as only small/general questions can be answered via email. Please schedule a consult at least 24 hours in advance (weekdays!).
A consult is by default online through MS Teams, you will receive a meeting invitation prior to the meeting.
Use this tool to schedule a consult: METHODOLOGYSHOP Planner (utwente.nl)
FYI: The consultants can give advice on how and when to run a certain analysis, but will not carry out any analyses for you.
For all kinds of other questions, including small/general questions about research methodology or statistics, please send an email (in English) to methodologyshop@utwente.nl We will try to answer your email as soon as possible, but please note that it might take several days before you receive an answer.
Consultants:
Amira Shymbolatova (General, R)
For questions regarding SPSS please send an email to methodologyshop@utwente.nl.