EEG can be analyzed in many different ways and with many different types of software. At our Faculty we use the following types of software:
- Brainvision Analyzer (2.1), commercial software, see https://www.brainproducts.com
- BESA software (7.1), commerical software for source analysis and (source) coherence analysis, see https://www.besa.de/
- MNE software running under Python, free software (many options, also for fNIRS), see https://mne.tools/stable/index.html
EEG analyses can be performed in the so-called time domain, the frequency domain, and the time-frequency domain. Furthermore, information from the various domains can be used to determine source models that may account for observed EEG activity. The activity patterns at various sites can be compared to examine connectivity and changes in connectivity between conditions, or groups of participants. This can also be done at the source level (i.e., source coherence).
A very short overview
Event-related potentials (ERPs) are an example of analyses in the time domain. The general procedure to compute ERPs is to compute an average across several single EEG trials (cleaned from artefacts) that are time-locked to a certain event (i.e., a stimulus or a response). Here, the (often implicit) assumption is that EEG activity consists of high voltage background activity, and small but systematic activity related to a certain event. After averaging across a sufficient number of trials, the idea is that the background EEG averages out, while the systematic event-related activity remains. Indeed, after averaging across a large number of trials, a specific waveform emerges that with for example electrical stimuli has characteristic component like the N1 and the P3a (or P300) component.
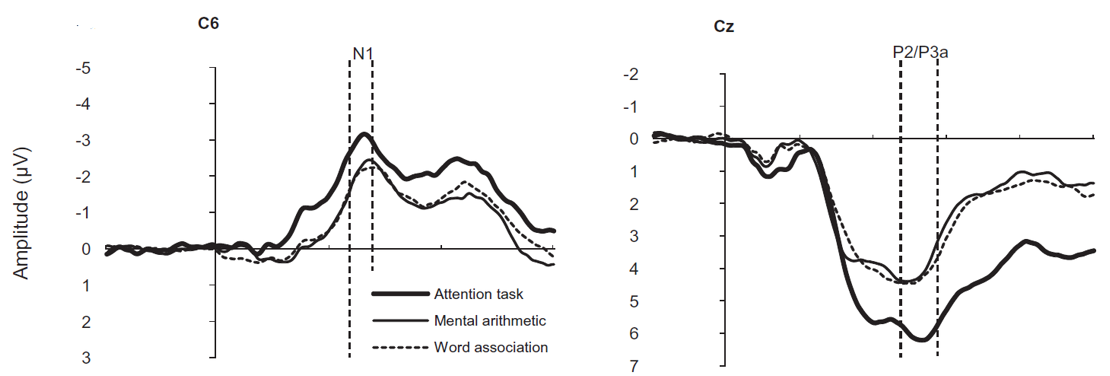
Fig. 2 Event-related potentials computed after presenting an electrical stimulus at the left forearm. Partcipants were either attending the stimuli, or were carrying out a mental arithmetic or a word association task. The amplitudes of the N1 and P2/P3a components were larger in the attention task than in the mental arithmetic or word association tasks. The displayed data relate to a paper published in 2012 by Blom and colleagues in the Journal of Psychophysiology: https://DOI: 10.1027/0269-8803/a000079
Analyses in the frequency domain tell us what basic frequencies are present in the EEG during a certain time period, which is often done by applying the fast fourier transform (FFT). Presence is often expressed in power (μV2). The basic EEG frequencies are the alpha band (~8-12 Hz), the beta band (~12-24 Hz), the theta band (~4-8 Hz), the delta band (~1-4 Hz), the sub-delta band (< 1 Hz), and the gamma band (> 24 Hz). The various frequency bands have been coupled to different processes or states, in general the idea is that relatively slow oscillations are related to inhibition (delta, theta, alpha), while fast oscillations (beta & gamma) are more related to active and attentive processing. Nevertheless, it has been argued that there are some exceptions, as frontal theta has for example been associated with increased mental effort.
Time-frequency analyses provide information about the presence of specific oscillations at a specific moment in time. One example of time-frequency analyses is Wavelet analyses. A wavelet can be described as a sinoid that is multiplied (or better convoluted) with a slow increasing and decreasing waveform. Application of the wavelet works like a filter that leaves oscillations within a smal frequency band (e.g., upper alpha [9.4-14.0 Hz)]), and estimates the strength of an oscillation at a moment in time as power, while also information about the phase of the oscillation can be determined. Wavelets can be computed by using a baseline as reference interval, but can also be determined without a baseline. An example of the outcome of wavelet analyses was presented in Fig. 1 at the homepage.