Renal CFD
Atherosclerotic renal disease is a frequent cause of uncontrolled hypertension and progressive renal insufficiency. Its prevalence has been estimated at 4.3% in autopsy studies, and is expected to further increase with an aging population. Treatment of renal artery stenosis (RAS) by percutaneous transluminal renal angioplasty and stenting (PTRAS) can significantly improve hypertension control and renal function, potentially reducing a patient’s risk on a future heart attack, stroke and haemodialysis. The high prevalence of RAS has therefore stimulated a wealth of research into a reliable diagnostic predictor of which patients will benefit from PTRAS based on anatomic characteristics such as diameter reduction, or flow characteristics like post-stenotic blood centerline velocity. However, current diagnostic procedures, including CT or MR angiography for evaluation of RAS have failed to predict which patients have a clinical benefit from revascularization, with a specificity marginally higher than 50%. The inability to accurately select patient that will benefit from revascularization may very well explain why past trials show, on average, only minimal benefit from revascularization compared to optimal medical therapy.
A more comprehensive hemodynamic indicator of stenosis severity is the translesional pressure drop under maximal blood flow (hyperemia, Fig. 1), which is currently considered the gold standard for the coronary artery to predict if a stenosis will benefit from treatment. The translesional pressure drop has traditionally been measured with invasive guidewire-mounted pressure sensors, but since recently the pressure drop can also be accurately estimated non-invasively with image-based computational fluid dynamics (CFD), based only on CTA imaging data. The latter non-invasive approach has been well-validated and recommended by the NICE-guidelines as first functional diagnostic for coronary artery stenoses before performing interventional diagnostic or treatment procedures. For RAS, the diagnostic potential of hyperemic translesional pressure drops (Fig. 1) has been evaluated in a few pilot studies, showing reasonable success in predicting treatment response to PTRAS (sensitivity and specificity over 80%). The primary goal of the present project is to develop and test a non-invasive diagnostic that can reliably estimate the translesional pressure drop under varying flowrates, based on patient-individualized CFD-models of the renal artery.
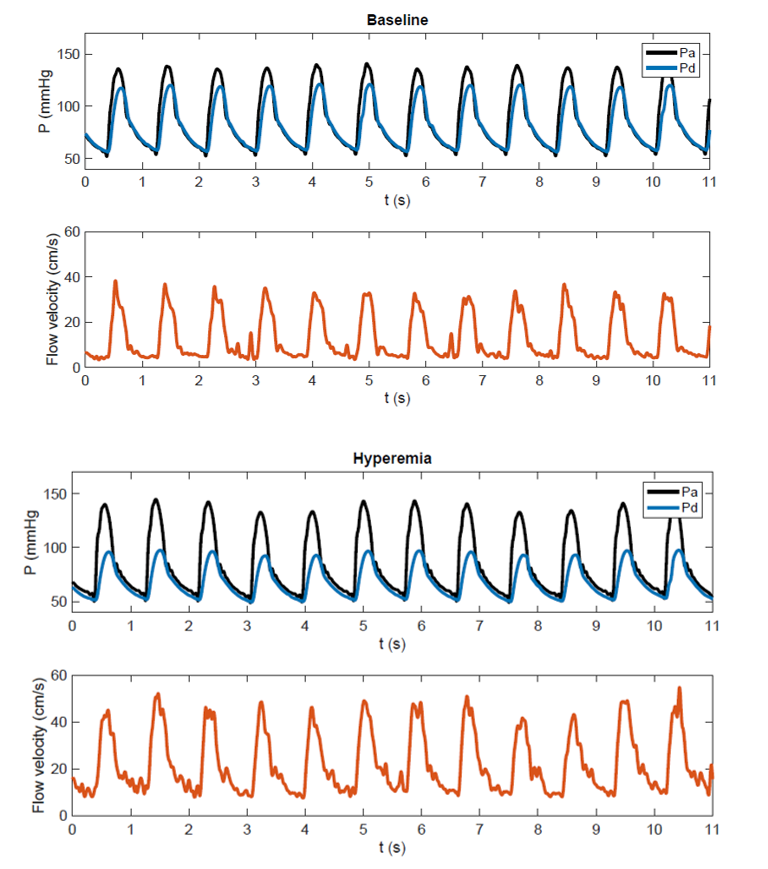
Figure 1: Combined pressure-flow measurement recently performed in a patient with renal artery stenosis. At baseline proximal (aortic) pressure and distal (post-stenotic renal artery) pressure show a modest difference. Under hyperemia following intra-renal dopamine an increase in flow and a significant fall in distal pressure are observed.
The project is composed of two phases, a validation phase (phase 1) and a retrospective study (phase 2). In the validation phase, invasive intrarenal pressure-flow measurements will be performed in 40 PTRAS patients with a thin micromanometer and doppler equipped guidewire. These measurements will help us acquire a thorough understanding of renovascular physiology and will serve as benchmark of CFD model development and sensitivity studies of relevant CFD input parameters. After development of a model that reliably estimates the hyperemic pressure gradient in stenosed renal artery, a retrospective cohort of patients (phase 2) that have received invasive treatment for RAS will be analyzed with the CFD models to assess the predictive ability of the flow simulations for identifying patients that had an improved clinical outcome after PTRAS treatment.
A pilot simulation result for a patient with a pinpoint renal artery stenosis is shown in Figure 2.
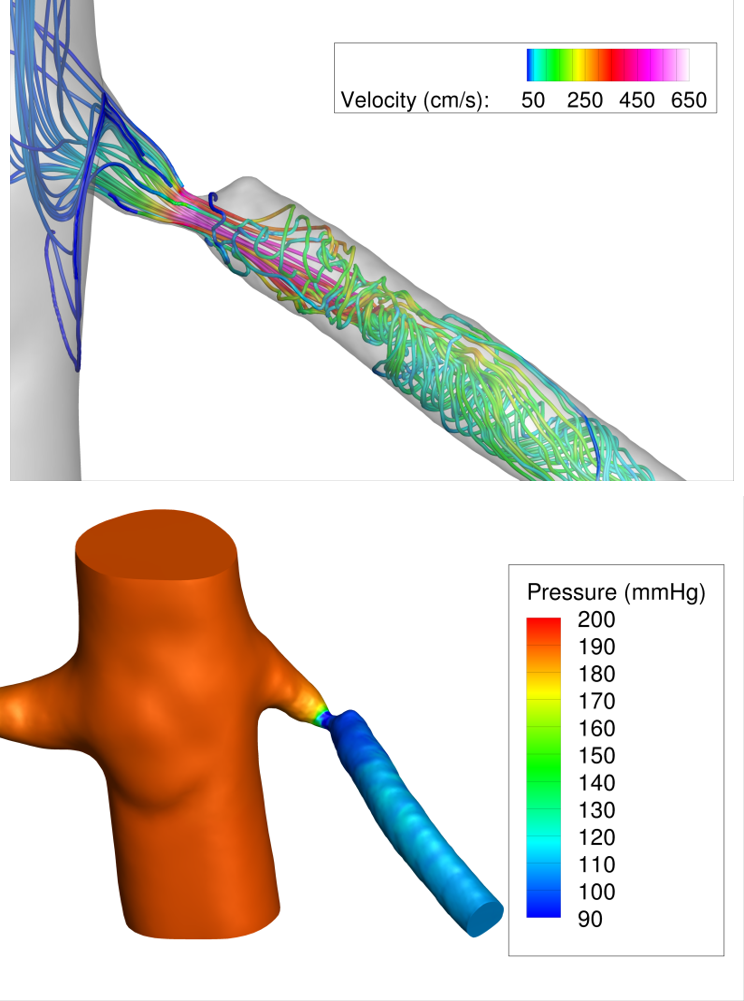
Figure 2: Pilot CFD simulations in a patient with a pinpoint renal artery stenosis. A physiologic state of maximal renal flow was simulated by lowering renal artery resistance by a factor of 2 compared to resting conditions. The pressure field and streamlines during systole are shown, highlighting the large pressure drop due to the stenosis (>80 mmHg) during maximal renal flow.