“We created our installation as part of our last module of the year. I study Creative Technology, so all our projects involve some sort of prototyping: from the initial research and brainstorming phase to actually designing and assembling the draft product. As this was the last project of my second year, everything we had studied so far was integrated into the assignment.
The project was about conveying a story or message through data physicalisation. Most people have heard of data visualisation, which means you try to make data more understandable by displaying it in graphs and other visuals. With data physicalisation, you take this one step further and try to communicate data in an even more immersive way, involving all five senses. This way, you can make data more tangible and engaging: people often have trouble interpreting numbers, but when made physical, they can understand and relate the numbers to their situation more easily. So, our assignment was to find a dataset and a compelling story to convey, and subsequently physicalise this data in a way we saw fit.
Screen time and (un)happiness
Finding an interesting message to convey and the accompanying data turned out to be quite challenging, though. With a group of ten enthusiastic Creative Technology students, hundreds of creative ideas fly around the table - which is fun, but doesn’t make it easier to take a specific direction. However, at some point, we stumbled across this interesting dataset about screen time and its correlation with self-reported unhappiness, which we decided to combine with a second dataset about screen time and phone notifications that we created ourselves. And boom: our message was born! Screen time and (un)happiness are such big topics in society right now, and almost everyone can relate to them in one way or another. Creating an experience that would help people understand this topic and reflect on their own behaviour, therefore, seemed like both an interesting and important goal and I’m very glad we settled on it!
Experiencing data
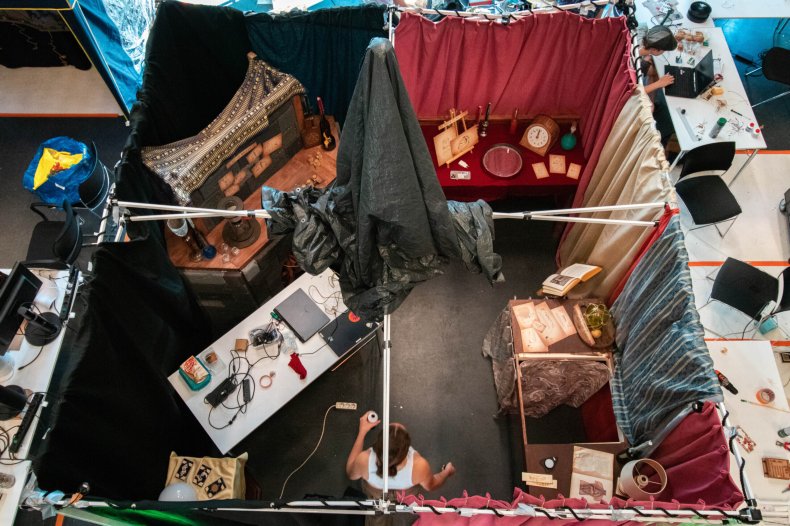
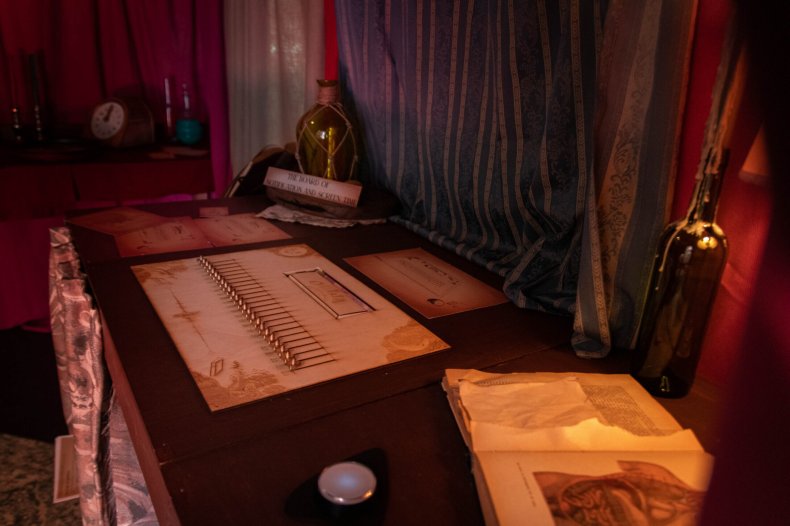
After plenty of brainstorming, sketching and data interpreting, we could finally get to actually making our installation. This was my favourite part of the project, as I enjoy building things and we could really see our vision come to life piece by piece! Eventually, we ended up with this interactive installation that you could enter – kind of like an escape room, but without the game element. Within the tent, we created multiple elements that you could interact with as a visitor.
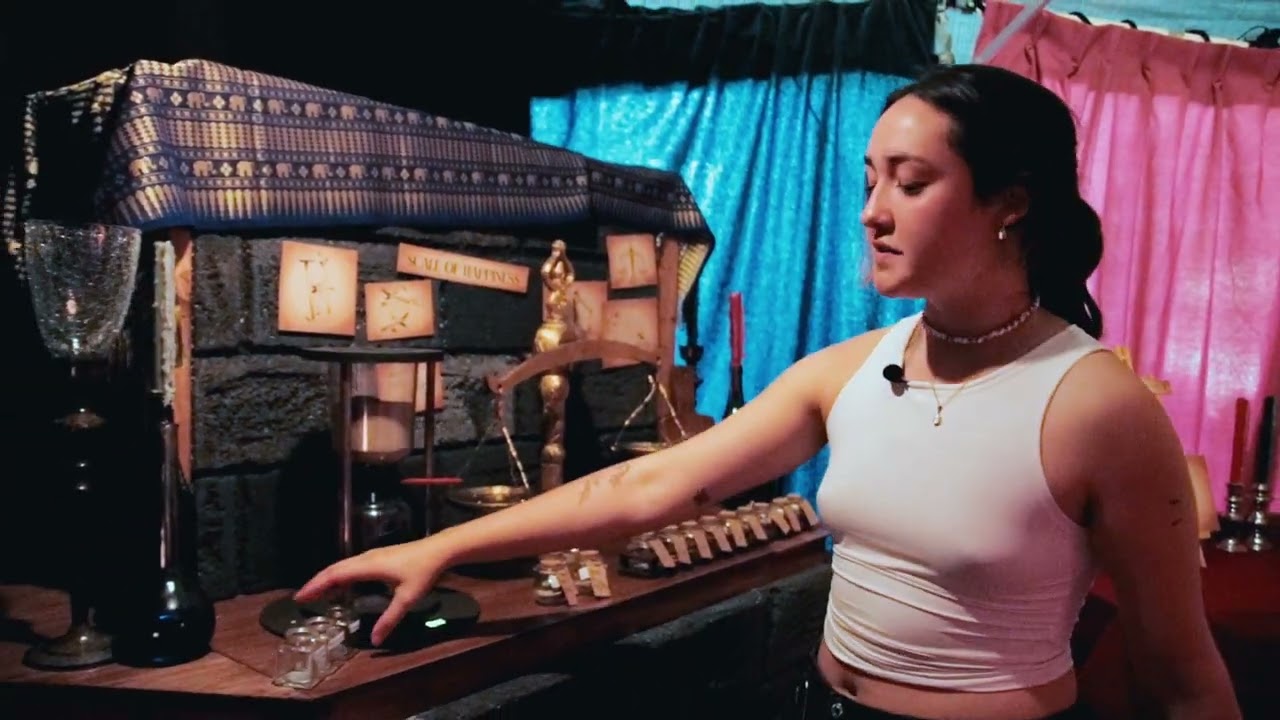
First, we had ‘the mirror of self-esteem’, where participants had to enter their average screen time on a clock. Subsequently, the mirror would become more or less blurry, displaying how spending a lot of time online may alter your self-perception and -esteem. Then we had the ‘scale of happiness’, which allowed the participants to compare their average screen time spent on e.g. gaming or social media with the amount of screen time the data set determined as healthy. Lastly, we created a ‘board of notification and screen time’, where participants had to enter both their screen time and the number of notifications received on a specific day, after which they would receive a graph of the correlation between the two.
While building the installation, we did not only pay a lot of attention to the storytelling and data physicalisation, but also to the aesthetics and overall user experience. For example, we had an audio guide talk the participants all through the installation. At the end of it, the guide would also provide a personalised message on a tarot card, based on the input given by the participant during the experience. By making it such an immersive and responsive installation, we hope that we have given the participants the time and space to really reflect on their well-being and how this relates to their screen time – in a fun way, of course!
New beginnings
Ultimately, I’m very proud of the product we managed to create. From soft- and hardware design to data interpretation and storytelling – everything we’ve learned in the past two years came together in our installation, which made it both super fun and challenging. Especially working with such a big group was a challenge sometimes, so I learned a lot about effective brainstorming, time planning and managing expectations. However, I am so glad that we went about the project the way we did: seeing it being displayed on the demo market and being able to see our friends, family and study staff experience the installation itself was definitely one of the highlights of the year!
Now that I’ve finished my second year in Creative Technology, we’re onto new beginnings: I will soon start my electives. During my electives I will be following my own path of interest, so this was the last project I’ve worked on with my classmates for the foreseeable future. Although I am happy and proud to have finished this part of my studies, I am going to miss these long, exciting days of working on the project with my team – being productive, of course, but above all, having a lot of fun together. Working so dedicatedly on a project together for weeks on end really strengthens you as a team and gives you this feeling of unity. However, I’m also excited to start this next phase. I feel like the past two years have equipped me well – let’s see what’s up next!”
