QA TESTING OF ITER NB3SN AND NBTI SUPERCONDUCTING STRANDS ON CRITICAL CURRENT, RRR, AC LOSS, TWIST PITCH, CU:NONCU RATIO, DIAMETER AND CR-THICKNESS
Research financially supported by the ITER Organisation and F4E. 

The world-wide procurement of Nb3Sn and NbTi for the ITER superconducting magnet systems will involve eight to ten strand suppliers from six Domestic Agencies (DAs) on three continents. To ensure accurate and consistent measurement of the physical and superconducting properties of the composite strand, a large strand test facility benchmarking effort was performed. The objectives of this effort were to assess and improve the superconducting strand test and sample preparation technologies at each DA and supplier, in preparation for the more than 10,000 samples that will be tested during ITER procurement.
The benchmarking includes tests for critical current, n-index, hysteresis loss, residual resistivity ratio, strand diameter, Cu fraction, twist pitch, twist direction, and metal plating thickness (Cr or Ni). The University of Twente has extensive experience and highly developed standards on benchmarking (since 1994) of superconductor wire tests (critical current, stress-strain, AC loss etc). The EMS group actively contributed to the presently used methods, among others in VAMAS programs. The University of Twente is an acknowledged and well established qualified ITER Reference Laboratory.
Critical current
The voltage – current transition can be measured between zero and 2000 A, with variable temperature and magnet field. For the ITER verification measurements the critical current (at an electric field level of 10 μV/m) is determined at magnet field levels of 11.5, 12.0 and 12.5 T and a temperature of 4.23 K. The temperature of the helium bath is accurately monitored and all instruments are yearly calibrated. Below, a critical current sample is shown under preparation and ready for test.

A critical current sample under preparation according to a defined procedure with defined wire tension (left)and a barrel sample ready to be tested with high current lead connections, soldered copper rings and voltage taps.
RRR
The residual resistivity ratio (RRR) value is derived as the ratio of resistance values at, respectively, 273 K and 20 K. The test provides the RRR value, the resistance values at the various temperatures and the sample current value used in the measurements. To this aim, a dedicated probe for RRR testing is developed in Twente for a sample length of 40 mm with calibrated temperature monitoring. Alternatively a commercial Oxford PPMS system is available.
Hysteresis loss
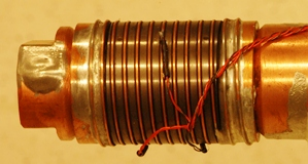
The hysteresis loss is measured with a superconducting integrator pick-up coil set in a superconducting solenoid magnet. Some typical results of coiled samples with an inner diameter of 40 mm and a height of 18 mm (wire length 180 mm) are given below. The advantage of this method is besides high accuracy, real time monitoring of the sample magnetization. This is very useful when studying for example flux jumps behavior at low magnet fields.
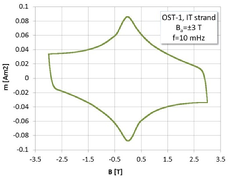
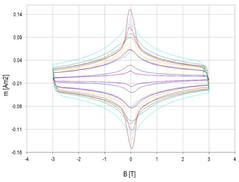
Examples of measured magnetization (m) curves with the applied magnet field sweep between -3 T and +3 T amplitude and at low ramping rate (T=4.23 K).
Cu:nonCu ratio
Various SEMs analytical methods are available for polished cross section measurement and software image analysis. In particular, a high level expertise is on hand for polishing of composite superconductor wire, i.e. Nb3Sn samples. A very precise chemical method is also offered by etching with nitric acid and correlating the difference in weight to the volume by density.
Twist pitch
The twist pitch of a superconducting wire is determined by etching of the outer copper shell or by taking a longitudinal cross-section micrograph under a microscope (SEM). The twist pitch is recognised by the 4-1-4-1….. repetition of filament bundles or by the angle of the filaments. The sample length for ITER wires is taken 100 mm.
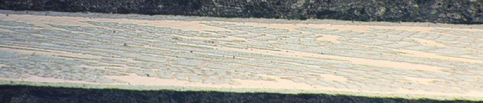
Micrograph of a longitudinal cross-section.
Cr/Ni-plating thickness
The chromium or nickel plating thickness can be determined on a polished strand cross section by SEM micrography. According to the specification it is recommended to measure the Cr layer thickness at six locations, at 60° each and with an accuracy better than 10 nm. At the University of Twente, in addition a method is available using etching with HCl (Cr) and determine the thickness by weight to volume with density. It can be noted that the etching method used for the benchmarking actions, provides the most accurate value for the average Cr plating thickness, excluding possible smearing effects from polishing, but gives no insight in local deviations, which could be an advantage of the method with cross section and SEM.
Ovens for heat treatments
The oven capacity consists of tube ovens (3 in 1 combination) with a total effective content of 60 critical current samples and a temperature stability of ± 1 ºC with a homogeneity of ± 1 ºC along 0.15 m. The vacuum pressure is 5•10-3 mbar but also inert gas flow can be applied. In addition a large tube oven with capacity for coil and large sample heat treatments. The capacity amounts to more than 200 critical current samples and the temperature stability is ± 2 ºC with a homogeneity of ± 2 ºC along 0.3 m. The vacuum level amounts to 10-4 mbar or the heat treatment can be carried out under inert gas flow.
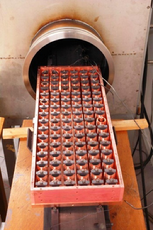
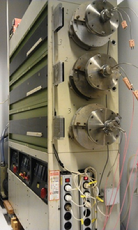
A cassette element with critical current samples ready to be inserted in the large tube oven for vacuum heat treatment (left) and the three-tube oven with independent temperature control.
Summary of recent University of Twente results
The tables below give a summary of the comparison between benchmarking results from University of Twente and average of involved laboratories.
Results of Benchmarking on the laboratory self-prepared Bronze strand 01BR8305A01C samples.
ID | Diameter [mm] | Cr-plating Thickness [m] | Twist Pitch [mm] | Cu/ non-Cu | RRR | Ic [A], (12 T) | n-value (12 T) | Hysteresis Loss [kJ/m3] |
Twente | 0.819 | 0.98 | 14.5 | 0.93 | 144 | 187.6 / 190.0* | 42.6 | 42.4 |
average | 0.820 | 1.1 | 16.0 | 0.94 | 134 | 188.1 | 42.7 | 42.2 |
std dev | 0.001 | 0.21 | 1.0 | 0.024 | 21 | 3.5 | 1.9 | 2.9 |
*Agreement between IO prepared Round Robin samples and self-prepared Benchmark samples prepared at Twente is very good, the small difference in results is consistent with the expected difference based on the use of epoxy (standard method in Twente) as pointed out in Appendix 1 and the spread is by far within 1 %.
Ic and n-value results at 12 T of IO prepared Round Robin Benchmarking on three 01BR8305A07C Bronze strand samples.
ID | 01BR8305A07C-14 | 01BR8305A07C-15 | 01BR8305A07C-16 | |||
Ic [A] | n-value | Ic [A] | n-value | Ic [A] | n-value | |
Twente | 188.8 | 44.1 | 188.3 | 43.3 | 189.1 | 43.4 |
CERN average | Ic = 188.7 A (st dev = 1.8 A), n= 41.4 (std dev = 1.4) | |||||
All labs average | Ic = 189.1 A (st dev = 2.1 A), n= 43.5 (std dev = 3.5) | |||||
For more information, please contact Arend Nijhuis: ![]()
![]()
Links: ITER, F4E
Papers on this subject:
- H.G.M. Knoopers, A. Nijhuis, E.J.G. Krooshoop, H.H.J. ten Kate, P. Bruzzone, P.J. Lee, and A.A Squitieri, ‘Third Round of the ITER Nb3Sn Strand Bench Mark Test’ Proc. EUCAS’97, Veldhoven, Applied Superconductivity, no. 158, July, (1997) 1271-1274
- A. Godeke, A. Nijhuis, B ten Haken, P. Bruzzone, and H.H.J. ten Kate ‘Angular dependence of Critical Current versus Magnetic Field in Nb3Sn Wires at 9-15 T’, Proc. EUCAS’97, Veldhoven, Applied Superconductivity, no. 158, July, (1997) 917-920
- Matthew C. Jewell, Thierry Boutboul, Luc-Rene Oberli, Fang Liu, Yu Wu, Alexander Vostner, Takaaki Isono, Yoshikazu Takahashi, Soo-Hyeon Park, Alexander Shikov, Alexandra Vorobieva, Nicolai Martovetsky, Kazutaka Seo, Denis Bessette, and Arnaud Devred, ‘World-Wide Benchmarking of ITER Nb3Sn Strand Test Facilities’ IEEE Trans App Supercond 20, 2010, p
- I. Pong, M. C. Jewell, B. Bordini, L-R. Oberli, S. Liu, F. Long, T. Boutboul, P. Readman, S.-H. Park, P.-Y. Park, V. Pantsyrny, V. Tronza, N. Martovetsky, J. Lu, A. Devred, ‘Worldwide Benchmarking of ITER Internal Tin Nb3Sn and NbTi Strands Test Facilities’, MT-22 Paper 1GP1-9, 2012
- C. Schmidt, K. Itoh, H. Wada, ‘Second VAMAS a.c. loss measurement intercomparison: a.c. magnetization measurement of hysteresis and coupling losses in NbTi multifilamentary strands’, Cryogenics 37, 1997, p 77–89
- Godeke A, Turrioni D, Boutboul T, Cheggour N, Ghosh AK, Goodrich LF, Meinesz M, den Ouden A,’ Interlaboratory Comparisons of NbTi Critical Current Measurements’ IEEE Trans App Supercond 19, 2009, p 2633
- A. den Ouden, T. Boutboul, D. Pedrini, V. Previtali, L. Quettier, and G. Volpini, Critical Current Measurements on Nb3Sn Conductors for the NED Project, IEEE Trans App Supercond 16, 2006, p.1265