The human eye
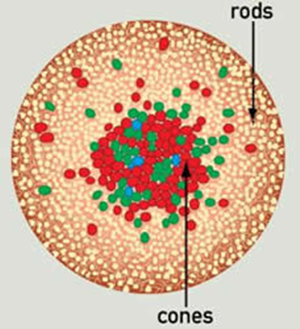
Having two eyes allows us to see the three-dimensional world around us. But each eye individually offers us something unique: colour vision. We think we understand how it works. Our eyes have a layer with three different types of sensors, called cones. These cones are sensitive to three different but overlapping colour regions of the visible spectrum: red, green, and blue. We will leave out the rods, which work in low light, for now.

Illustration of the human eye with rods and cones.
Colour perception
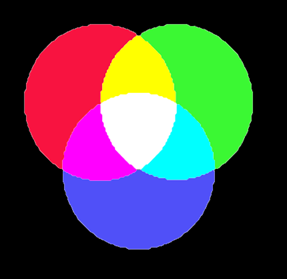
The measurements these cones make give us the sense of a specific colour by mixing colours. For example, red plus green gives us yellow. That sounds very simple, but there are still things we don't know. How many of these sensors do we have? In what proportion? How are they distributed? Do they all work? Do we really know how we perceive colours?
Everyday experiences
In daily life, I often have discussions with my wife about colours. For example, when I want to wear that nice green shirt, she says, "No, that's blue." Knowing what I know, I can't argue and say I'm right because she might be right from her perspective. Additionally, we might have been raised in different cultures by different parents. What if I learned that oranges are blue?
Colour display
Imagine displaying a slide on the screen and zooming in on a small part of your screen. You would see the individual LEDs emitting specific colours. This is a magnified portion of a slide on the screen:

When you move back to a certain distance, these individual LEDs are no longer distinguishable, and the separate colours they emit blend into something new: what we perceive as a specific colour. The above is a small part of the following slide. But which part?

Implications for image analysis
Due to the subjectivity of visual interpretation, at the Faculty of Geo-Information Science and Earth Observation (ITC), we emphasise quantitative analysis using actual values or measurements instead of displayed colours on a screen. Another consequence of possible ambiguity is that visual interpretation workflows should use example moments instead of descriptive or summary colours. This also allows the inclusion of other visual variables besides colour, such as patterns, textures, and size.
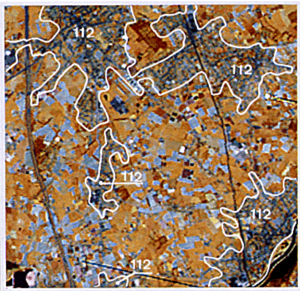
The CORINE Landcover database, released in 1990, was based on visual interpretation by multiple people at multiple locations using satellite images. The colour combination (selection of spectral bands to assign red, green, and blue on the screen) was predefined, but to minimise interpretation subjectivity, all interpreters received an interpretation guide with actual examples of how to interpret the images.

Example of a satellite image from the CORINE Landcover database
But is an orange orange?
What does this all mean? It means that we can agree that we are both looking at an orange, but we can't guarantee that we see exactly the same thing. We assume we do, but that doesn't have to be true for actual perception or measurement, let alone what someone makes of it. Compared to the physical measurement of incoming radiation on the cones, our brain - influenced by our environment and upbringing - translates the measurements into a colour. And colours can even have different meanings in different cultures or circumstances. There is much more to discover!
So, next time you show an image from your analysis to someone else, remember that they might not see exactly what you see!


