
PhD Student
E-mail: a.encisomartinez@utwente.nl
Telephone: +31 53 489 3062
Fax: +31 53 489 3511
Address: Faculty of Science and Technology
Medical Cell BioPhysics (MCBP)
Building: Carré
Room: CR4435
Drienerlolaan 5
P.O. Box 217
7500 AE Enschede
The Netherlands
Project goals
The aim of the Cancer-ID program is to develop novel technology for monitoring Cancer therapy through revealing the extracellular vesicle IDentity (Cancer-ID). Specifically, this project focuses on the characterization and identification of tumor-derived extracellular vesicles by means of scanning electron microscopy and Raman spectroscopy.
Project background
Recent studies have shown that small lipid-membrane-bound vesicles called extracellular vesicles, derived from cancer cells, play a role in tumor cell proliferation, migration, invasion and metastasis.1–3 In fact, tumor-derived extracellular vesicles (tdEVs) in blood could extravasate into a tissue creating a proper microenvironment for tumor development and metastasis.3 Typically, extracellular vesicles (EVs) are secreted by a variety of mammalian cell types and have been known to play a key role in intercellular communication in a paracrine and/or autocrine manner.3 Such ultra-small vesicles (between 30 to 1000 nanometer size range in diameter) are able to transport proteins, nucleic acids and membrane components to neighboring or distant cells, influencing cellular behaviors. Hence, EVs derived from diseased cells, such as cancer cells, could trigger oncogenic signals and promote tumor development.2
In recent years, it has become generally accepted by the scientific and clinical communities that body fluids, i.e. blood, urine and cerebrospinal fluid contain a large amount of EVs. Under physiological conditions, blood contains 106-1012 EVs per mL4,5 that derive from blood cells and the vessel wall.6 Under pathological conditions, such as cancer, tdEVs will enter the blood;7–9 thus, a fraction of EVs in blood will come from cancer cells (Fig. 1). Identifying and characterizing such tdEVs can provide relevant information for cancer diagnosis, optimal therapy and monitoring of therapy. However, the identification of tdEVs can be challenging due to their heterogeneity, their ultra-small size, their size overlap with many other normal EVs and contaminants in body fluids, and the lack of knowledge on their chemical composition.
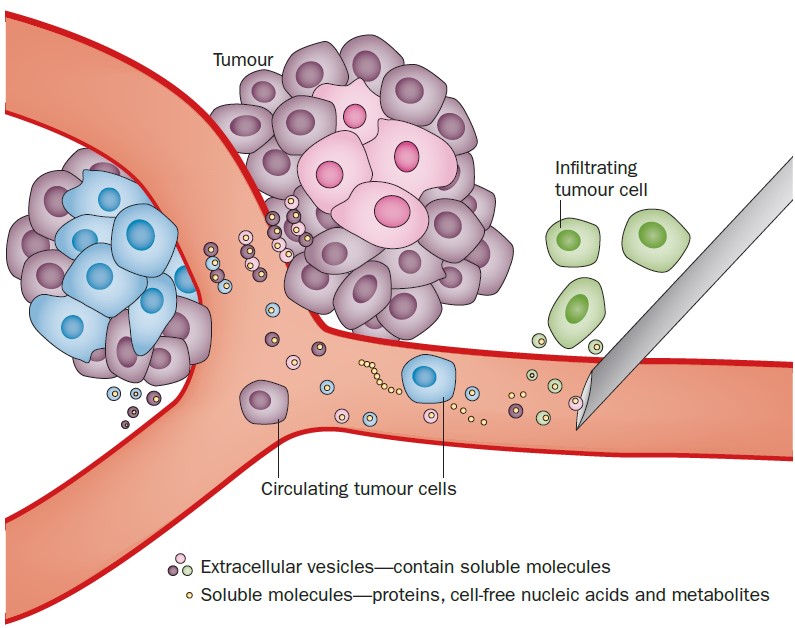
Figure 1. Cartoon showing tumor-derived extracellular vesicles being released by cancer cells into the blood stream.11
The aim of this project is to disclose EV size, morphology and chemical content by means of correlative scanning electron microscopy (SEM) and Raman spectroscopy, in order to identify tdEVs. This includes the development of a sample preparation protocol and workflow strategy for combined SEM - Raman spectroscopy. While SEM assesses EV morphology, Raman spectroscopy discloses its biochemical composition. By correlating morphological and chemical features, objective identification and classification of EVs can be achieved.
SEM is used to overcome the resolution limit of optical microscopy (approximately 0.2 µm). This technique uses a beam of accelerated electrons focused on a small spot in the sample. Such beam can be raster scanned over the sample surface that consequently scatters electrons that are captured by a detector. An image is then formed revealing structural details with a resolution up the nanometer scale.
Raman micro-spectroscopy is used to obtain the EV chemical composition. This is a label-free imaging technique that, based on inelastic light scattering from molecules, provides spectral characterization of compounds in the Raman microscopic focus. Thus, Raman spectroscopy can provide information on lipids, nucleotides, proteins, sugars and metabolites present in EVs. In addition, a confocal Raman microscope image can be obtained by 2D - stage scanning.
A Raman image can be correlated with its corresponding SEM image for the combination of chemical specific contrast with electron microscopic resolution. Correlative imaging is achieved through an integration of the Raman microscope into the SEM vacuum chamber.10 SEM is used to locate the EVs on a substrate and subsequently, Raman spectroscopy is performed on those locations, resulting in a dataset of thousands of Raman spectra of individual EVs. Thus, EVs can be characterized both, chemically as well as morphologically. Multivariate data analysis can then be used to classify EVs in different groups, e.g. normal and tumor-derived EVs. Hence, identification and characterization of EVs by means of SEM – Raman spectroscopy is a promising method that can provide relevant information for cancer diagnosis and prognosis.
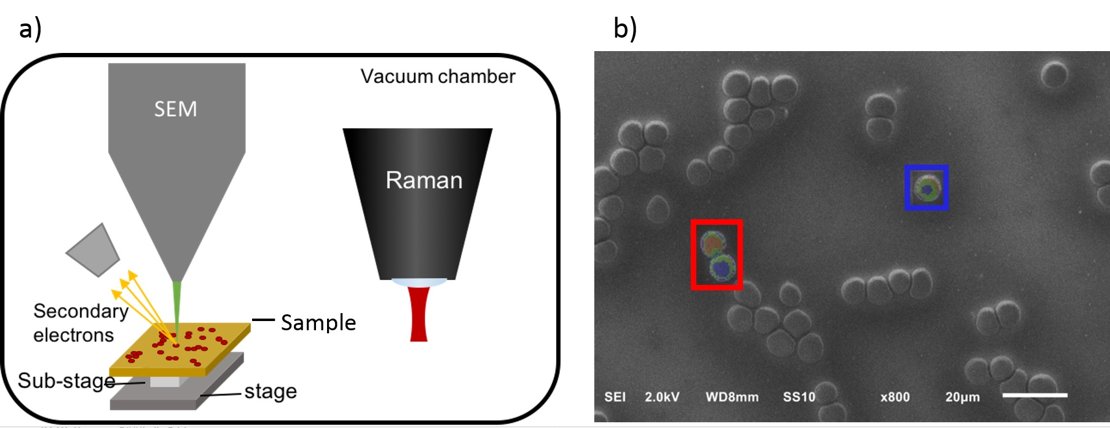
Figure 2. a) Integrated SEM-Raman microscope. b) Correlative SEM-Raman image of erythrocytes.
Collaboration
- HybriScan Technologies
- JEOL
- Academisch Medisch Centrum, Amsterdam
References
1 P. Vader, X. O. Breakefield and M. J. A. Wood, Trends Mol. Med., 2014, 20, 385–393.
2 T. Katsuda, N. Kosaka and T. Ochiya, Proteomics, 2014, 14, 412–425.
3 M. Kanada, M. H. Bachmann and C. H. Contag, TRENDS in CANCER, 2016, 2, 84–94.
4 E. van der Pol, A. N. Böing, P. Harrison, A. Sturk and R. Nieuwland, Pharmacol. Rev., 2012, 64, 676–705.
5 N. Arraud, R. Linares, S. Tan, C. Gounou, J.-M. Pasquet, S. Mornet and A. R. Brisson, J. Thromb. Haemost., 2014, 12, 614–627.
6 R. J. Berckmans, R. Nieuwland, A. N. Böing, F. P. Romijn, C. E. Hack and A. Sturk, Thromb. Haemost., 2001, 85, 639–46.
7 J. I. Zwicker, H. A. Liebman, D. Neuberg, R. Lacroix, K. A. Bauer, B. C. Furie and B. Furie, Clin. Cancer Res., 2009, 15, 6830–40.
8 J. Li, C. A. Sherman-Baust, M. Tsai-Turton, R. E. Bristow, R. B. Roden and P. J. Morin, BMC Cancer, 2009, 9, 244.
9 F. A. W. Coumans, C. J. M. Doggen, G. Attard, J. S. de Bono and L. W. M. M. Terstappen, Ann. Oncol. Off. J. Eur. Soc. Med. Oncol., 2010, 21, 1851–7.
10 F. J. Timmermans, B. Liszka, A. T. M. Lenferink, H. A. G. M. van Wolferen and C. Otto, J. Raman Spectrosc., 2016, 47, 956–962.
11 M. Westphal and K. Lamszus, Nat. Rev. Neurol., 2015, 11, 556–566.